Read TL;DR
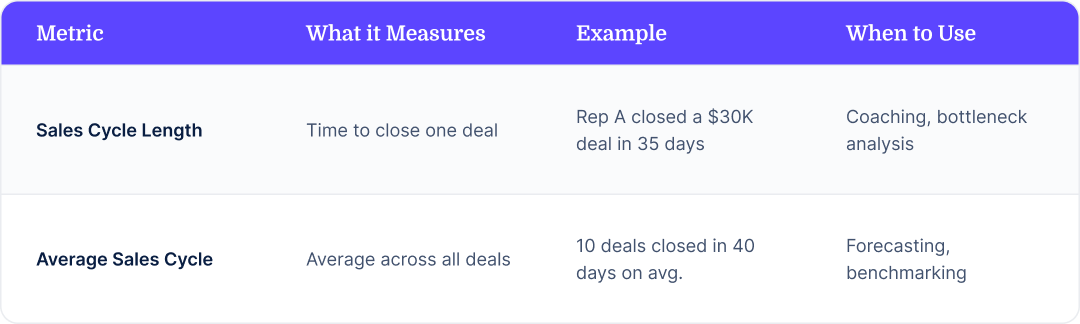
- Sales Cycle Length (SCL) tracks how long it takes to close a specific deal. It offers deal-level clarity you can’t get from average sales cycles.
- Average Sales Cycle smooths timelines across deals and shows how long your team typically takes to close. It’s useful for benchmarking and forecasting.
- Tracking both helps you spot stuck deals, identify process breakdowns, and improve pipeline velocity, without relying on gut feel.
- Misunderstanding or misaligning definitions can skew your metrics and cloud decision-making. Consistent tracking requires standardized pipeline logic across teams.
- With Drivetrain, you can track both metrics in real time, slice by segment, product, or rep, and turn sales data into strategic improvements.
When you hear a prospect say any of these thing, you know the deal isn’t closing tomorrow:
“I need to discuss with the board.”
“I need to run it by my cofounder.”
“I need to loop in procurement.”
And your next thought is, "How long will it actually take to win this deal?"
If you’re tracking sales cycle length, you may be able to predict this with reasonable accuracy. Unlike the average sales cycle, which smooths out the story, sales cycle length is tracked at the individual deal level, which provides important context that you can use to coach better, forecast smarter, and fix what’s slowing your pipeline down.
In this case, looking at past deals similar to the one in question can help you better predict how long it will take to close.
Summary
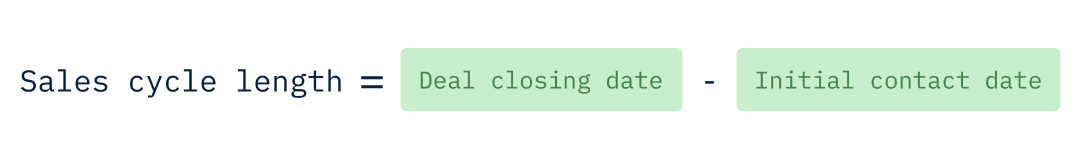
Sales Cycle Length (SCL) is the number of days it takes to close an individual deal, from the first meaningful prospect interaction to a signed contract.
Sales teams in almost every business track their average sales cycle. While an average can give you a good idea of how long it should take to close a deal, it won’t offer any insight as to why a specific deal might be stuck or why one AE is able to close deals faster than the rest of the team.
Sales cycle length can, and this guide will explain how. You’ll learn what sales cycle length is (and what it isn’t) and how to use it, along with your average sales cycle, to improve forecasts, coach reps with context, and move high-intent prospects through your pipeline faster.
What is sales cycle length?
A sales cycle outlines the process your sales team follows to turn prospects into paying customers. This usually includes stages like prospecting, discovery, proposal, close, and sometimes post-sale touchpoints like onboarding or renewal, depending on your GTM.
Regardless of how it's scoped, the way you measure it has a direct impact on your ability to forecast revenue, coach reps, and identify operational inefficiencies.
And more importantly, to make those measurements meaningful, you need to track how long it takes to move prospects through them. This is where sales cycle length comes in.
Sales cycle length (SCL) is the number of days it takes to close a specific deal, from the moment a prospect enters your pipeline to the day the contract is signed. It’s a deal-by-deal view of how long a specific sale took to close. SCL provides context that is essential for a deeper understanding of things like pipeline velocity, quota attainment, and other aspects of your sales process that impact performance.
There are several factors that influence SCL:
- Deal size (ACV) and complexity: Larger contracts typically involve more stakeholders, longer approval cycles, and legal reviews.
- Lead source: Inbound leads are already problem-aware and they often move faster than outbound leads that require education.
- Buyer decision process: Some organizations require formal RFPs or multi-department approvals, while others move with agility.
- Sales team responsiveness: Faster follow-up, better qualification, and stronger discovery often translate to shorter cycles.
- Market timing: Budget cycles, economic climate, or procurement freezes can extend deal duration regardless of buyer intent.
Sales cycle length vs. average sales cycle
Sales cycle length measures how long an individual deal takes to close, from entry to closed-won.
Average sales cycle, by contrast, tracks how long it typically takes to close deals over a defined period (monthly, quarterly, or annually).
Why you should track both metrics and how to use them together
To help you understand why these differences matter, let’s assume your average sales cycle is 30 days. That might look good on the surface. But unlike sales cycle length, it won’t tell you:
- That a $90K deal has been open for 60+ days with no movement.
- That one rep consistently closes in half the time, but her deals churn within a quarter.
- That outbound-sourced deals for your new product line take twice as long to convert as inbound ones.
Those insights don’t show up when you’re only tracking the average sales cycle. That’s why you need both metrics:
- Use sales cycle length for deal-level visibility—to spot stuck deals, investigate friction in specific stages, and isolate performance by rep or segment.
- Use your average sales cycle to set internal benchmarks, model sales velocity (aka pipeline velocity), and track improvements quarter over quarter.
Tracking both metrics will give you a zoomed-in and zoomed-out view of your pipeline. Sales cycle length helps you track where you are slowing down, while the average sales cycle helps you to see if you’re improving over time.
Sales cycle length vs. sales velocity
Sales cycle length tells you how long it takes to close a specific deal. Sales velocity, on the other hand, measures how fast your entire pipeline is turning into revenue.
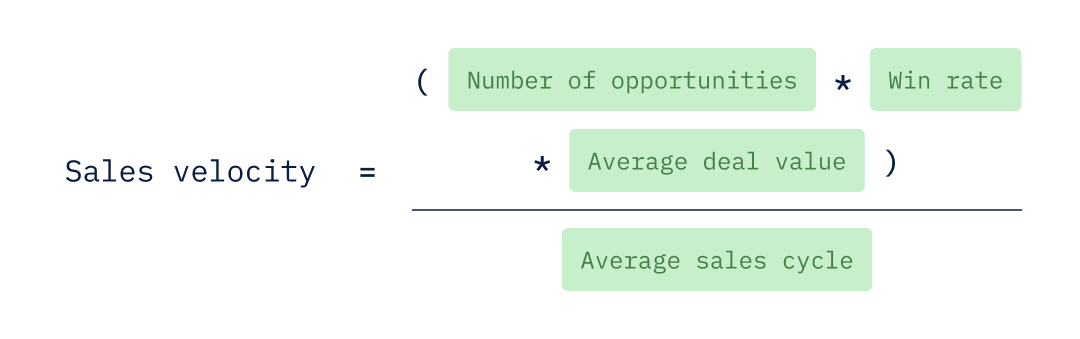
As you can see from the formula, sales velocity uses average sales cycle length as an input. However, relying on that alone can be misleading.
To illustrate this better, imagine your average sales cycle drops from 40 to 30 days. On paper, your velocity increases. But if a few high-value enterprise deals are quietly slipping past 90 days, you’re not moving faster; you’re misreading the pace.
That’s why relying solely on sales velocity can create false confidence. That’s why relying solely on sales velocity can create false confidence. One way to avoid this is to use pipeline-based forecasting with win rate data, which will more accurately reflect pipeline momentum.
However, you can also use sales cycle length together with sales velocity to gain a more realistic picture of pipeline speed.
Why you should track both metrics and how to use them together
Both metrics are important to track because they’re complementary:
- Sales cycle length gives you micro-level clarity. It shows which deals are on track, which are slipping, and where buyer friction occurs. This is critical for diagnosing stage-level issues, coaching reps, or preventing pipeline slippage.
- Sales velocity gives you macro-level insight. It helps you evaluate how efficiently your pipeline is converting to revenue, especially when modeling revenue scenarios, planning headcount, or tracking performance across quarters.
Used together, these metrics help you to identify where you are slowing down and what that slowdown is costing you.
Track just one, and you risk reacting to the wrong signal.
Track both, and you gain the operational clarity to optimize your pipeline for both speed and profitability, so it doesn’t just look busy, it performs.
Why tracking your sales cycle length matters
Many companies obsess over their average sales cycle because it can indicate whether their sales process is speeding up or slowing down over time. Of course, this is important information to have. But, it doesn’t tell the full story about how your pipeline is functioning.
Here’s why.
The average sales cycle smooths over everything. The whole point of an average is to give you an overall trend. And, like any average, the average sales cycle distills out nuances in your data, masking deal-specific factors that could offer real leverage.
Sales cycle length provides those insights. By analyzing how long each individual deal takes to close, you get better visibility into:
- Outliers: Deals that close significantly faster or slower than the norm. Taking a closer look at both can help you better understand what’s working well and what isn’t.
- Hidden bottlenecks: You can more easily spot delays that consistently show up in negotiation, legal, procurement, or approvals.
- Sales rep behaviors: For example, some reps may rush through the qualification stage but consistently stall out in pricing conversations.
This kind of visibility allows you to shift the conversation from "what happened?" to "why is it happening, and how do we fix it?"
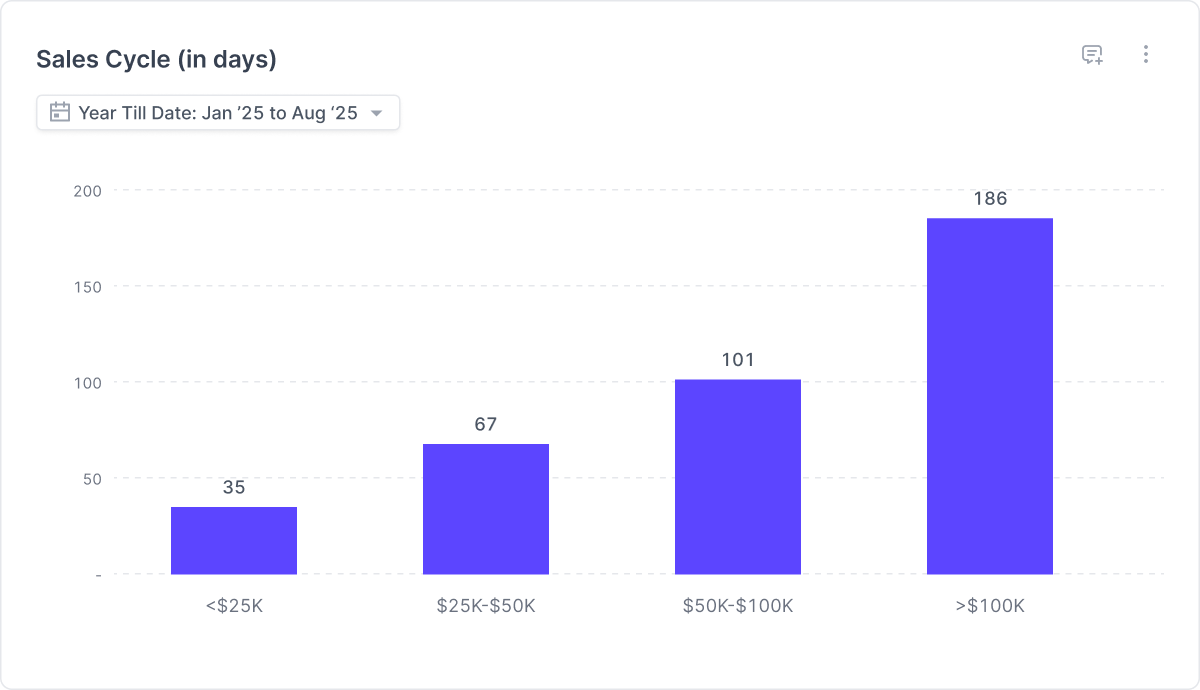
Take enterprise deals, for example. Longer cycles are expected due to compliance and stakeholder alignment. But when you isolate SCL across similar deal types, you might notice that,
- Inbound enterprise deals close 20% faster than outbound ones.
- Deals in healthcare lag because of procurement red tape.
- One sales pod consistently adds 15 days post-demo due to follow-up gaps.
These insights point directly to the fixes you need to make in your process, which might include the following:
- If SCL consistently spikes between demo and proposal, you may need to revisit how reps qualify needs or transition to pricing.
- If the contract stage adds 14+ days, it could be a signal to pre-negotiate legal templates or adopt a risk-based redlining policy.
- If one vertical moves significantly faster, it might be worth doubling down with focused campaigns or dedicated reps.
In each case, sales cycle length shows where your process is breaking down and gives you the data needed to improve it. Looking at SCL can also help you more accurately evaluate your pipeline coverage so you can make sure your funnel has the volume needed to hit your targets.
Beyond process fixes, SCL also improves forecasting. Most revenue forecasts rely on stage and deal size. But that’s so 2D.
Add SCL by segment or product line into your forecasting, and now you can model how long deals actually take. Pairing SCL with probability-weighted sales forecasting, you replace your “best guesses” about when different deals will close with data-backed projections you can trust.
When it comes to the health of your deals, SCL also offers real-time alerts. A stagnant opportunity 20 days past the median close time for that segment isn’t just “taking longer”, it’s a red flag. Maybe the buyer lost the budget. Maybe your champion left. Either way, SCL gives sales managers a signal to intervene before the quarter slips.
Put simply, average sales cycle tells you what’s typical, while sales cycle length tells you where to look closer. Together, they give you a full picture of your sales pipeline’s performance, from high-level trends to frontline friction.
That’s how you move from just tracking pipeline metrics to actively improving them.


How to calculate your sales cycle length and average sales cycle
Below is the formula for calculating sales cycle length:
Example of sales cycle length calculations
Let’s look at two deals to show how different pipelines and buyer behavior can shape sales cycle length:
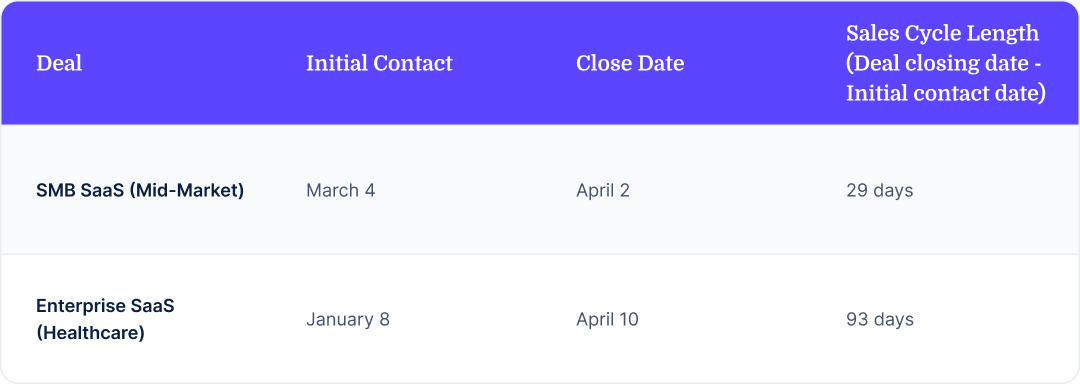
As you can see from the example, the deal with mid-market SaaS moved fast. This is typical of mid-market SaaS with a clear buyer need. In contrast, the deal with enterprise SaaS took longer to close as it involves multiple stakeholders, legal reviews, and procurement delays.
Both are valid deals, but they tell very different stories. That’s the power of tracking at the individual level. It highlights real variation and insight into why certain types of deals behave differently. That’s something you can’t spot with an average sales cycle alone.
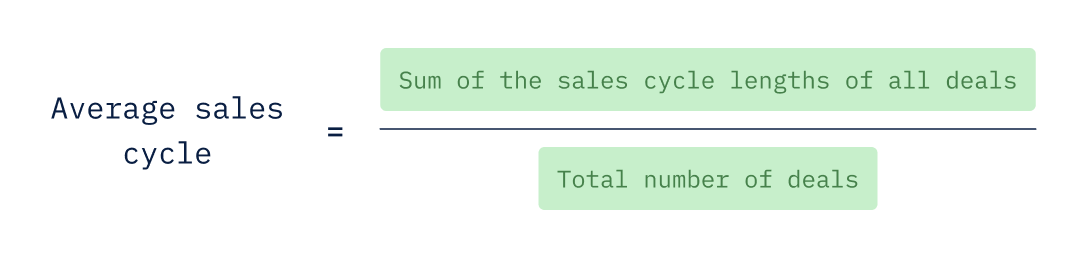
That being said, while sales cycle length is precise and contextual, the average sales cycle looks at how long your team typically takes to close deals across a defined time frame, such as a month or a quarter. It’s useful for benchmarking performance and modeling pipeline velocity.
Here’s the formula to calculate the average sales cycle:
Example of average sales cycle calculations
Let’s walk through two different examples to illustrate how the average sales cycle can vary based on deal type, sales motion, and buyer complexity.
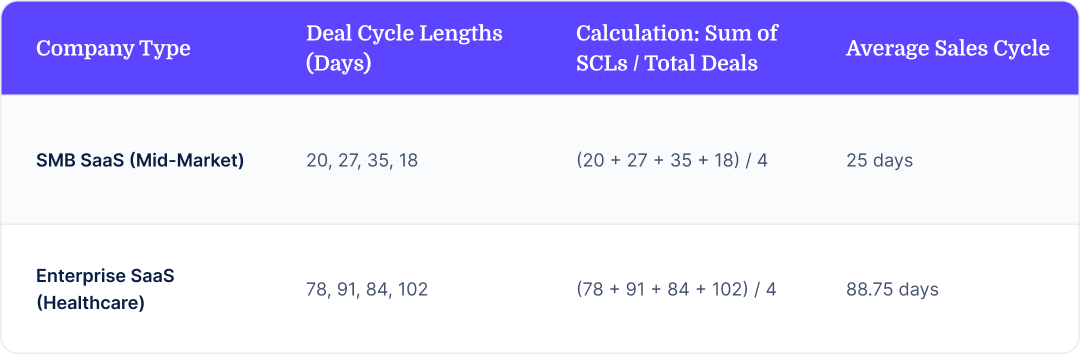
You’ll notice that while the formula stays the same, the outcome looks very different. And that’s the point.
The average sales cycle is influenced not just by the number of deals, but by the underlying dynamics of each type of sale, deal complexity, buyer readiness, internal approvals, and more.
That’s why your pipeline definitions matter. Numbers can get skewed if teams aren’t aligned on what counts as a deal’s start and end. One team might measure from MQL, another from SQL. One might mark “closed-won” when verbal approval is given, another when the contract is signed.
To put it in perspective, a deal measured from MQL to signature will naturally have a longer cycle than one measured from SQL to closed-won. And if your CRM stage definitions shift mid-quarter, you’ll end up comparing apples to oranges in your reporting.
To ensure your metrics tell the truth and stay useful across teams, you need to track them consistently. That starts with aligning definitions and building logic into your systems:
1. Align on definitions across teams
Pick one starting point (e.g., opportunity created) and one ending point (e.g., contract signed), and apply it across your CRM. Then document it. That’s what turns SCL from a one-off report into a standard KPI you can use quarter after quarter.
Example: A “30-day” cycle from demo to close means something very different than 30 days from lead capture to invoice. Same math, different meaning.
2. Set your CRM up for consistency
Whether you’re using Salesforce, HubSpot, or another CRM, build your sales cycle logic into the system, not your spreadsheets. Use stage timestamps, standardized deal fields, and automated triggers to ensure the metric doesn’t shift when territories, team structures, or process flows change.
3. Segment before you compare
A blended sales cycle across all products, markets, and segments hides what’s actually happening.
Instead, slice by:
- Rep or team
- Lead source (inbound vs outbound)
- Deal size or segment (SMB vs enterprise)
- Product line or use case
That’s how you uncover which parts of the business are working and which ones need attention.
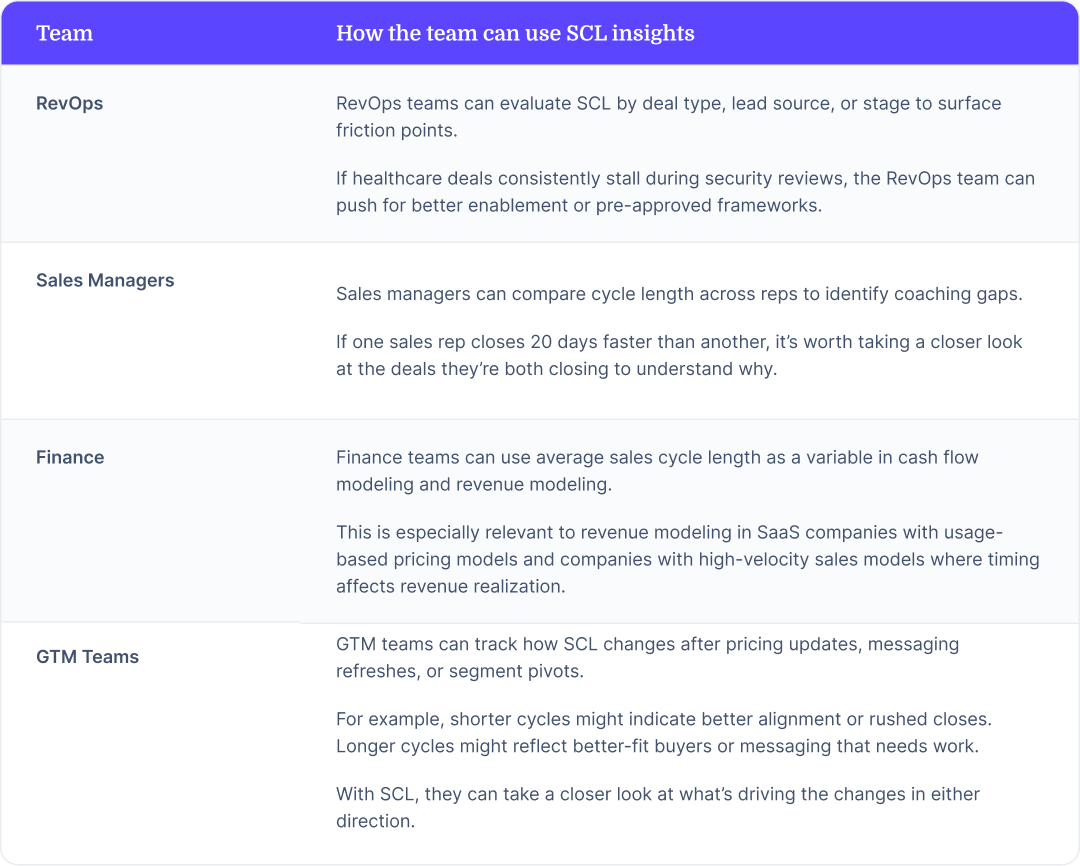
How to act on the SCL insights
Tracking SCL and average sales cycle consistently creates the foundation for smarter decisions across your go-to-market org. Here's how different teams can apply it:
Benchmarks for average sales cycles in SaaS and other industries
While the main focus of this article is sales cycle length—a deal-specific metric—industry benchmarks are almost always reported as average sales cycles. Reliable benchmarks give you a starting point to compare your pipeline performance against others in your category and spark the right internal questions.
Let’s take a look at some SaaS benchmarks for example. According to SaaStr, the average sales cycle for SaaS businesses typically varies based on market segment:
- SMB SaaS: 1-2 months
- Mid-market SaaS: 3-4 months
- Enterprise SaaS: 6–9 months
These figures reflect what most SaaS leaders experience across hundreds of companies.
The key drivers here?
- Pricing strategy: Higher pricing tiers trigger more scrutiny. Freemium or pay-as-you-go products often close faster.
- Deal size (ACV): A 60-day sales cycle may be slow for a $5K deal, but fast for a $100K one, as higher-value deals usually involve more stakeholders, deeper due diligence, and longer procurement cycles.
- Market differences: Selling to startups? Expect agility. Selling to public-sector healthcare? Brace for procurement delays.
- Software complexity: The more technical depth or integration effort required, the longer the decision window, especially in SaaS.
- Customer profile: A 5-person startup won’t have the same stakeholder landscape or budget review process as a Fortune 500.
This example for the SaaS industry illustrates how there can be several different drivers that can impact your average sales cycles. This is true of any industry. In addition, there can be a lot of variability within a single industry based on size, geographic region, pricing, etc.
This is why it’s important to segment and interpret any benchmarks for average sales cycle you find for your industry by deal type and context, keeping in mind that they are best used as a starting point, not a universal target.
10 best practices to improve your sales cycle length
1. Start with smarter qualification
Review your lead scoring and qualification process. If reps are chasing low-fit leads, your cycle will drag by default. Tighten criteria to focus on high-intent, high-fit prospects who are actually ready to buy.
2. Meet your prospects where they are in their buying journey
Don’t force your sales process onto your customer. Map your sales stages to how your buyers actually evaluate, champion, and procure new tools. The closer the fit, the smoother the sale.
3. Use preferred channels
Outbound that ignores buyer behavior is just noise. Reach prospects through their preferred channels, be it email, in-app chat, LinkedIn, or referral. Relevance increases response rates and reduces early drop-off.
4. Involve the right people early
Delays often happen because legal, finance, or IT weren’t looped in soon enough. Use qualification calls to identify all stakeholders and bring them in early, especially for complex or enterprise deals.
5. Train with real-world scenarios
Sales scripts are useful, but simulations based on actual deal patterns are better. Roleplay with real objections, procurement red flags, or persona-specific friction points to build rep confidence and fluency.
6. Equip reps with the right content, at the right time
Provide targeted case studies, ROI calculators, battle cards, or comparison guides to unblock specific decision points. The right asset at the right stage builds trust and accelerates movement.
7. Optimize follow-ups
Stalled deals often stem from weak follow-up. Use personalized nudges that recap value, address next steps, or add urgency (e.g., limited-time pilot access). Don’t let deals die from silence.
8. Track what actually moves deals
Go beyond stage progression. Track SCL by rep, segment, and lead source to spot bottlenecks and replicable wins. If healthcare inbound moves 2x faster than outbound retail, double down.
9. Automate the slow parts
Use automation and AI for scheduling, lead routing, proposal generation, or contract redlining. Each task you automate removes a lag point and helps reps stay focused on high-value work.
10. Iterate for continuous improvement
Your sales cycle isn’t static. Review what's working quarterly. Iterate on qualification criteria, enablement content, or objection handling. A 10% improvement per stage compounds across your funnel.
How Drivetrain can help you track and improve sales cycle length
Sales cycle length and average sales cycle are powerful indicators of where your pipeline is slowing down, why deals stall, and how efficiently you’re turning intent into revenue. Pipeline coverage ratio is another important metric you can use to quantify how much pipeline you need to stay on track given your average sales cycle. The problem is, tracking these and other key metrics in a spreadsheet or the default dashboard in your CRM limits your ability to leverage the insights they could otherwise provide.
You need the ability to zoom in on deal-level delays, zoom out to spot trends across quarters, and layer in filters like deal size, lead source, and individual sales reps
Drivetrain gives you the infrastructure to go beyond basic reporting:
- Track sales metrics in real time – With 800+ native integrations (including Salesforce, HubSpot, and more), Drivetrain consolidates your pipeline data in one view, so you don’t have to chase it down across different systems.
- Automate data cleanup and definitions – Avoid the risk of misaligned inputs. Drivetrain applies consistent logic across start/end dates, sales stages, and opportunity types to keep your metrics apples-to-apples even as your team scales.
- Analyze trends with dynamic dashboards – Build live dashboards that show how SCL and average sales cycle vary by product, rep, or ICP. Use this to guide coaching, allocate resources, and sharpen GTM alignment. In Drivetrain, it’s easy to build a high impact sales analysis and reporting dashboard.
- Run what-if scenarios for cycle optimization – Want to see how SCL changes under different pricing models, verticals, or deal structures? Drivetrain’s scenario planning tools let you model that with zero guesswork.
- Forecast with precision – Pair sales cycle metrics with pipeline forecasting to predict not just how much you’ll close, but when. This gives you more confidence in headcount planning, revenue timing, and investor updates. With Drivetrain, you can visualize this in real time using dynamic forecasting dashboards built on live deal data.

A screenshot of Drivetrain’s pipeline forecast dashboard, displaying predicted revenue by deal stage, close date, and rep segment.
Your CRM might store the data, but Drivetrain helps you leverage it for growth—to spot bottlenecks, test improvements, and accelerate the right deals faster.
Want to start turning sales metrics into strategy?
If so, it's probably time to explore Drivetrain.

FAQs
At a minimum, review sales cycle length and average sales cycle quarterly. But high-growth SaaS teams, especially those iterating on GTM, pricing, or ICP will benefit from monthly analysis, especially if they’re using sales cycle metrics to drive rep coaching, forecast adjustments, or process experiments.
PLG motions often blur the line between user and buyer. A user might activate and find value before sales even engage. In these cases, the sales cycle length should start at the first qualified selling interaction, not user signup. For accurate comparisons, segment PLG deals separately from traditional inbound or outbound motions.
No. Average sales cycle should only include closed-won deals. Including lost or no-decision deals skews your benchmark downward, making it harder to set realistic expectations for pipeline velocity and forecasting.
Like this article?
.svg)

.svg)
.svg)


