
Read TL;DR
- The logo retention rate measures customer renewals over time. It provides important insights into customer satisfaction alongside traditional metrics like net promoter scores and customer satisfaction scores.
- Click here to learn how it's calculated.
- According to RevOps Squared's 2022 B2B SaaS Benchmarks, median logo retention across companies is 85%, though rates vary by company size - from 89% for companies with $1-5M ARR to 83% for those with $50-100M ARR.
- While high NRR/GRR numbers might suggest strong performance, examining logo retention can reveal hidden problems. For example, a company might show healthy overall retention metrics while masking significant customer losses in specific segments.
- The metric becomes particularly valuable for companies with lower annual contract values, while those exceeding $10K per customer find gross dollar retention more informative.
- Want to simplify tracking of your cohort-based metrics? Learn how Drivetrain can help.
As the SaaS industry continues to grow and the market becomes even more crowded, SaaS companies are going to have to work hard to win new customers and even harder to keep them. Customer retention is critical to a SaaS company’s success, and churn can be deadly.
Summary
Logo retention rate is a common metric used to evaluate customer retention and can offer useful insights to guide strategic decision-making.
When combined with its revenue-based "cousins", net revenue retention (NRR) and gross revenue retention (GRR), along with revenue churn rate, logo retention rate offers a more complete view of your company's ability to retain its customers.
In this article you'll learn how calculate and track logo retention and how you can combine it with other SaaS metrics, like NRR and GRR, to spot underlying issues in your business you might otherwise miss. We'll also share some benchmarks to help you evaluate how your logo retention measures up.
Why SaaS companies need to track their logo retention rates?
When people think about customer satisfaction metrics in SaaS, net promoter scores and customer satisfaction scores immediately come to mind. However, logo retention rate is a reflection of your customers' satisfaction, too, and can offer valuable insights.
Logo retention rate is calculated based on the rate customers renew over a certain period. If fewer customers are renewing, that can indicate one or more of the following problems:
- Your customer support and/or customer success teams are struggling
- There's some friction in your customer onboarding process
- You don't have enough self-service resources available for customers to help themselves
Tracking your logo retention rate can also help you pinpoint specific trends, like the types of customers lost to churn. The table below illustrates how tracking logo retention rate can help you read between the lines to find hidden problems that can impact your revenue and which looking at NRR and GRR alone can obscure.
In this example, the company has two different segments, SMBs and enterprise customers. Based solely on NRR and GRR, the company appears to be doing quite well, at 109% and 97.2%, respectively. At 90% for its SMB segment and 95% for its enterprise segment, its logo retention rates seem pretty high, too.
However, context is everything. Here, it's important to consider the relationship between logo retention rate and logo churn rate, which can be seen in the equation below:
While the logo retention rates for these two segments might seem pretty good at first glance, their corresponding logo churn rates tell a different story.
This company started with 1,000 customers in its SMB segment at the beginning of the year and lost 100 of them within the following 12 months, which equates to a 10% churn in that segment.
In this example, the enterprise segment is propping up the entire business. But because expansion revenue and ticket sizes are typically higher with enterprise customers, the enterprise segment is obscuring the impact of churn in the SMB segment.
If this company is only looking at NRR and GRR, it's not going to see that it has a problem in its SMB segment.
The insight here is that customers in that segment are leaving in droves. It could be that there's a problem in the company's customer acquisition strategy. For example it may be attracting the wrong kinds of customers or acquiring customers in a region that isn't a good fit or where there's a competitor offering more or better features.
The beauty of tracking logo retention rate is that you can track it for any dimension that makes sense for your business (by geographic regions, market segment etc.) to gain valuable insights that NRR and GRR will always miss.
Another reason logo retention is important is that it offers investors deeper insights into a business's ability to retain customers. NRR and GRR, while primary criteria for SaaS valuations, can be misleading without also considering a company's logo retention numbers. Investors use all three SaaS metrics—logo retention, GRR, and NRR—for a complete picture of customer retention.
How to calculate logo retention rate?
Logo retention rate is a cohort-based metric, which means that customers are grouped (usually by month or by quarter) based on when they became customers. Retention is then tracked for each group or cohort of customers.
Retention is calculated with the following formula either monthly or yearly, depending on your subscription cycle, and expressed as a percentage:
Note that it is important to include only those customers who had the opportunity to renew at the month's start.


Example of how to calculate and track logo retention
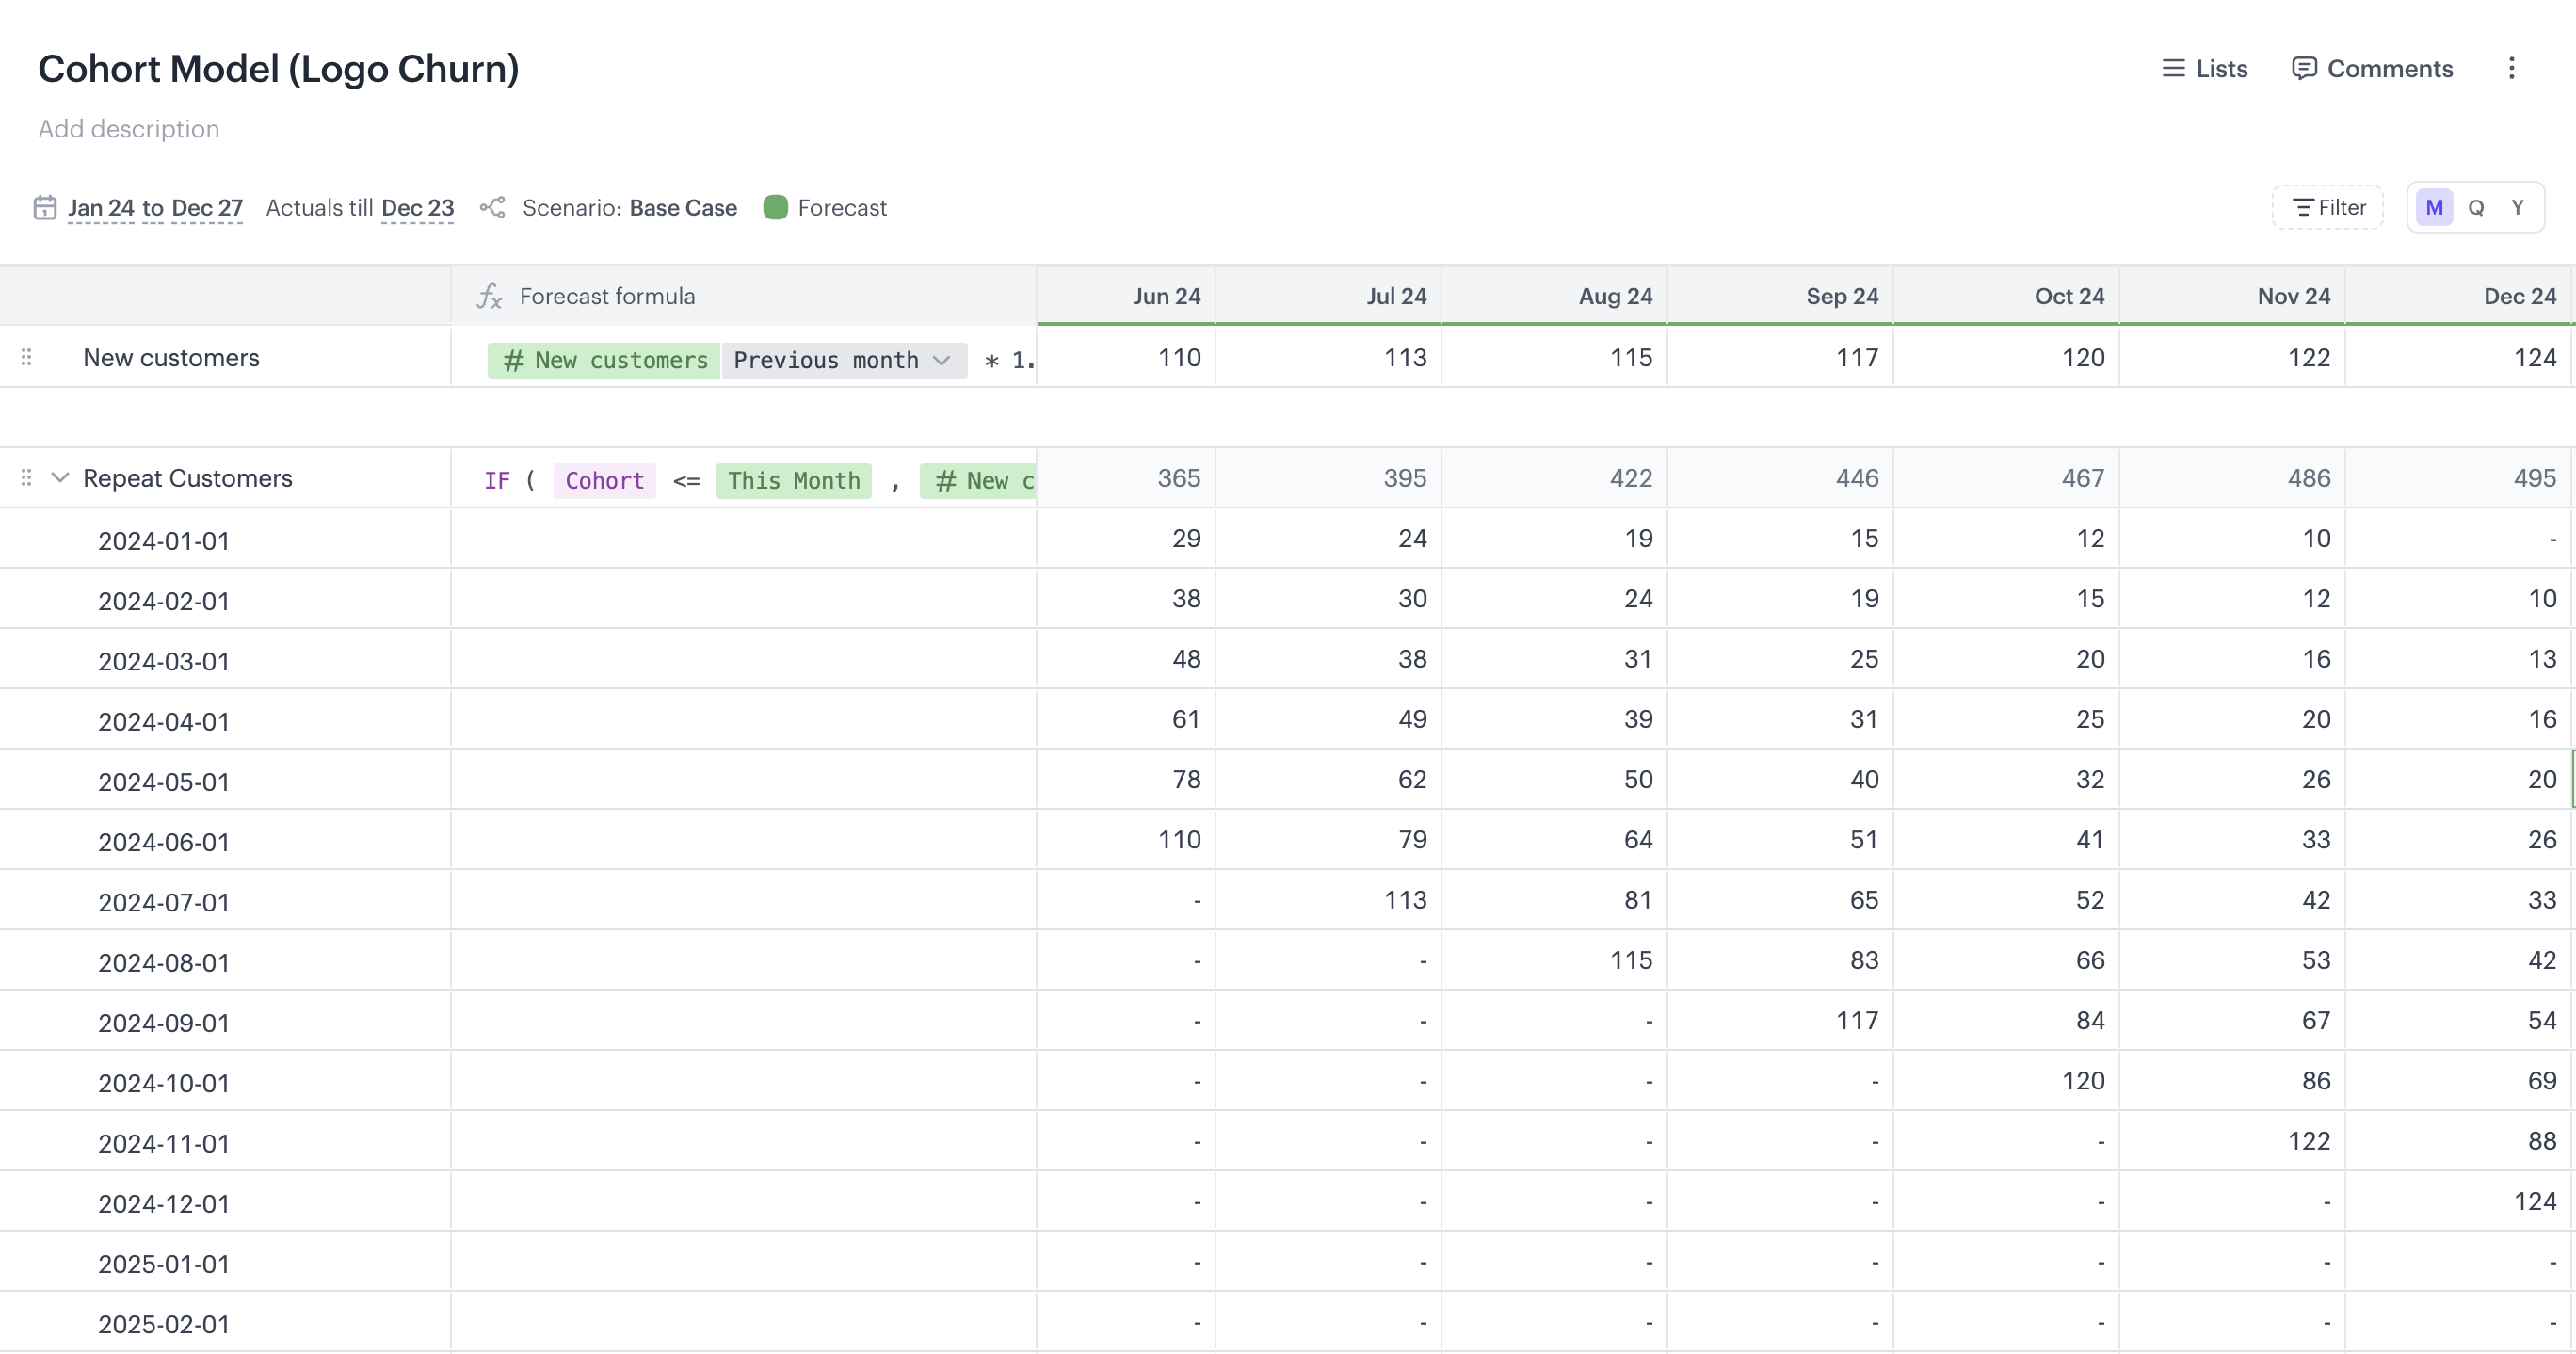
Our example uses a waterfall chart to track logo retention rate over time. For simplicity, we're assuming monthly subscriptions. The chart below shows the business gaining new customers each month during its first four months. However, concurrently, the percentage of customers churning is gradually decreasing.
Now, let's see the logo retention formula in practice. In our example, calculating for January 2023 assumes all customers renew monthly. For businesses with usage-based pricing or varied payment cycles, this calculation becomes much more complex.
What is a good logo retention rate in SaaS?
Logo retention benchmarks vary across industries and can differ within an industry based on organization size and type. However, in its 2022 SaaS Benchmarks Report, OpenView Partners found found that in SaaS, logo retention rates are not strongly correlated with business size.
The company also found that in high-velocity, lower-value annual contract value (ACV) contexts, logo retention rate (or its inverse, logo churn rate) is a valuable measure of customer retention. However, for businesses with an average ACV exceeding $10K, it becomes less informative when compared to gross dollar retention (also known as GRR).
The chart below shows the benchmarks for private SaaS companies reported in the 2022 B2B SaaS Benchmarks report, published by RevOps Squared.
However, use these benchmarks as a guideline and look for ways to make them actionable in your business to drive growth.
3 best practices for calculating logo retention rates
Monitoring logo retention rates offers insights into your company's health and potential areas for improvement. However, there are a few best practices for calculating and using logo retention to improve your business.
1. Define what should count as a churned customer
For logo retention calculations, establish a standard company policy to define which customers are considered churned. On the surface, what constitutes a churned customer seems simple enough. It's customers that have stopped paying you, right? That's the basic definition of churn, however this question can actually become complicated.
For example, you may have customers who are current on their payments and who intend to extend their contracts. However, if their contract extension isn't executed by the deadline or the end of the reporting period, they might inadvertently be considered churned. Another example is when you have a usage-based pricing models and some of your customers exhibit highly variable usage patterns. What happens the first time their usage drops to 0%. Are those customers then considered churned?
Given these complexities, it's important to decide how you will define logo retention and to develop standard procedures. Then make sure everyone in the organization understands them to ensure their consistent implementation.
2. Make sure you only include true customers in your calculation
SaaS providers offer free trials and freemium pricing models, leading to varying definitions of "customer" among companies. In our logo retention formula, "customer" means individuals generating recurring revenue from a paid subscription or contract. This is another aspect of determining how you will define logo retention for your business.
3. Balance your logo retention rates with the associated retention costs
Retention expenses should decrease over time, including costs for customer onboarding, advocacy, and customer success tools. As logo retention improves, focus on lowering retention costs per customer to optimize business strategies for long-term customer relationships.
What's really driving churn and retention in your business?
This is always the first question when a customer churns. There are a lot of variables that can factor into a customer's decision to part ways with your company, and the complete answer is almost always hidden in the numbers.
As a comprehensive financial planning and analysis (FP&A) platform, Drivetrain can help you figure it out quickly.
Drivetrain combines the ability to track any performance metric, including those that provide insight into how well your business is (or isn't) retaining customers. Beyond just looking at logo retention, you can track any number of SaaS metrics, financial and operational metrics, and even create your own custom metrics to dig deeply into the underlying drivers of logo retention in your business.
With Drivetrain's multi-dimensional analysis capabilities, you can quickly and easily see how different drivers, such as onboarding times and customer support response times, are interacting to impact churn and retention.
Drivetrain also simplifies cohort analysis, allowing you to sort your customer base into cohorts to calculate retention rates and track renewals, which can help support initiatives aimed at improving logo retention. If your company operates on a usage-based pricing model, you can track usage patterns to identify early indicators of churn.
And you can do all of this in real-time. Drivetrain offers more than 800 integrations to flow your data into one place where you can see it and dig into it to find the answers you're looking for. When the data changes, your model changes, too, allowing you to stay on top of all the areas of your business that can impact churn and retention.
Want to know more? Contact us for a free demo!

FAQs
Logo retention rate is a cohort-based metric that represents the percentage of customers who opt to renew.
The logo retention formula is as follows:
In its 2022 B2B SaaS Benchmarks Study, RevOps Squared found that median logo retention rates do not correlate with company size as measured by their ARR. Reported ranges for logo retention for companies based on size are shown below.

Logo retention rate is useful for SaaS companies to help guide their strategic decision-making. When combined with it's revenue-based "cousins", net revenue retention (NRR) and gross revenue retention (GRR), along with revenue churn rate, logo retention rate offers a more complete view of your company's ability to retain its customers.
A high churn rate indicates you’re losing customers, whereas a high retention rate indicates that you are keeping customers. The relationship between logo retention rate and logo churn rate is illustrated in the formula below:
Like this article?
.svg)

.svg)
.svg)
%20Header.svg)


