
Read TL;DR
- R&D as a percentage of revenue (aka R&D intensity) measures how much a SaaS company invests in innovation by dividing total R&D expenses (salaries, tools, infrastructure) by revenue.
- Higher R&D spend is common in early-stage SaaS companies (often 50% or more of revenue) while they’re building products and working to achieve product-market fit. Mature companies optimize R&D investment based on ROI and efficiency.
- To calculate, divide total R&D expenses by revenue and multiply by 100.
- While high R&D spend can drive growth, it must be balanced with other priorities.
- Tracking R&D headcount ratio and R&D productivity helps ensure sustainable investment.
Tracking research and development (R&D) as a percentage of revenue can help SaaS businesses make informed decisions about how to invest in existing products and when to build new ones to achieve sustainable growth. Often referred to as R&D intensity, R&D as a percentage of revenue is also considered a clear indicator of a SaaS company’s commitment to innovation.
Summary
Research and development (R&D) as a percentage of revenue is calculated as the total cost of R&D (tech teams salaries, benefits, cost of their tools and equipment) divided by revenue.
This guide will help you better understand the R&D as a percentage of revenue metric, how to calculate it, and how to use it to track efficiency and balance growth with strategic spending.
What is R&D in SaaS and why is it so important?
In the SaaS industry, ongoing investments in research and development (R&D) are essential for maintaining competitiveness. R&D encompasses all the activities associated with building, maintaining, improving, and innovating the products that SaaS companies sell.
For SaaS companies, R&D is the foundation of product development and can impact a company’s growth in several ways.
1. Product development and innovation
R&D drives the development of new features while enhancing existing ones. It enables startups to explore emerging technologies and address evolving market needs.
2. Strategic decision-making
R&D provides data-driven insights that help finance teams assess the viability of new projects and optimize resource allocation. Leaders rely on R&D as a percentage of revenue and other metrics to determine whether to continue investing in innovation or shift focus elsewhere.
3. Customer acquisition and retention
R&D is an investment that directly impacts a startup’s ability to attract and retain customers by developing features that address customer pain points and enhance user experience.
As companies progress through different stages of maturity, R&D spending becomes a fundamental driver of competitive advantage and financial performance.
R&D spending across the SaaS lifecycle
SaaS investments in R&D are strongly influenced by a company’s maturity:

Generally speaking, SaaS companies that invest heavily in R&D tend to achieve higher growth rates and stronger investor valuations. However, this isn’t true across the board. In markets where innovation is a key differentiator, high R&D spending is important whereas in more commoditized segments, companies may need to prioritize sales and marketing to capture market share.
How is R&D as a percentage of revenue calculated?
Before we start talking about how to calculate the metric, let’s do a quick review of the expenses that make up the R&D part of the equation.
Common R&D expenses in SaaS
For SaaS companies, R&D expenses include:
- Personnel costs: These include all employee-related expenses for software engineers, research scientists, data analysts, UX designers, and product managers that work to develop, maintain, and innovate products that a SaaS company sells.
- Software development costs: Software development costs in SaaS companies include investment in development tools and frameworks and third-party integrations.
- Cloud infrastructure costs: This includes cloud computing services, high-performance hardware, software licenses, and tools that enable research and product development specifically. Cloud costs associated with the delivery of SaaS would not be considered R&D but are instead treated as part of the cost of goods sold.
- Intellectual property and patent costs: These are software and tool licensing costs for specialized development environments, advanced analytics platforms, artificial intelligence research tools, and complex testing frameworks.
The R&D as a percentage of revenue formula with an example calculation
The formula for calculating R&D as a percentage of revenue is simple. It’s calculated by dividing the total cost of R&D (all the expenses in the list above) by total revenue, then multiplying by 100:

Let’s look at an example calculation for a mid-stage SaaS company with the following financial data:
- Annual revenue: $5 million
- Engineering team costs (10 developers): $1.5 million
- Product management team costs (2 managers): $300,000
- Design team costs (2 designers): $250,000
- QA team costs (2 testers): $200,000
- Development infrastructure and tools: $250,000
Total R&D expenses: $2.5 million
R&D% of Revenue = ($2.5 million / $5 million) × 100 = 50%
This 50% figure is fairly typical for a growth-stage SaaS company that has established a product-market fit (PMF) but is still heavily investing in product development to drive future growth.
Looking at R&D as a percentage of revenue in isolation can be misleading, though. For example, high R&D spend as a percentage of revenue is not necessarily bad assuming the return on those dollars is high. For example, a company investing in an entirely new, innovative product starting from the ground up may have a high R&D percentage of revenue because they are investing ahead of revenue.
Other important metrics to look at when evaluating R&D investments
The R&D as a percentage of revenue metric is most useful when considered alongside other SaaS metrics, which together can provide a more complete view of R&D efficiency and effectiveness:
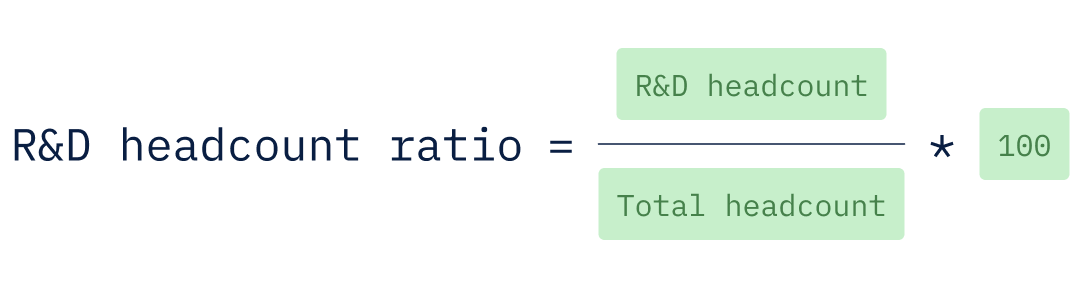
R&D headcount ratio
It’s the percentage of R&D employees relative to total headcount indicates a company's focus on product development.
- Early-stage SaaS companies typically have 50-70% of employees in R&D
- Mature companies see this drop to 30-40% as sales, marketing, and customer success teams grow.
Formula
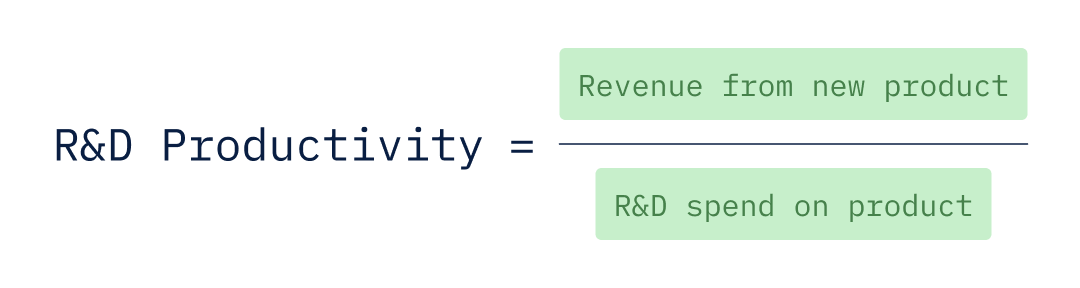
R&D productivity
This metric measures how effectively R&D investments drive revenue. It becomes critical from Series B onward when companies invest in new products beyond their core offering.
Formula


SaaS industry benchmarks for R&D spending
Industry benchmarks for R&D spending can vary widely based on a company’s strategy, market, and growth stage. High-growth SaaS companies often allocate a larger percentage of revenue to R&D to drive innovation, while others may prioritize sales and marketing.
SaaS Capital recently released its 14th annual spending survey of more than 1,000 private B2B SaaS companies and found that the median ARR spent on R&D was 22%. The report also shows that regardless of company size or funding type (bootstrapped vs. equity backed), R&D spending is higher than any other expense category.
BenchMarkit’s 2024 B2B SaaS Performance Metrics Benchmark Report, which also surveyed about 1,000 private companies, shows a median of around 31% of revenue invested in R&D.
The median R&D as a percentage of revenue appears to be lower for publicly traded companies, which spend around 17% of their revenue on R&D according to benchmarks published by Meritech.
Benchmarking your R&D spend to other SaaS businesses can be useful, however, it shouldn’t dictate strategy. Every company optimizes their R&D spend based on its unique strengths:
- Product-led companies invest heavily in R&D to differentiate through innovation.
- Sales-driven SaaS businesses focus more on go-to-market execution.
R&D is a high-impact, but finite resource. Simply matching industry benchmarks isn’t enough. SaaS companies must ensure every dollar spent aligns with long-term business objectives, driving both product excellence and sustainable growth.
How to track and monitor R&D expenses
Assessing the ROI of R&D spend isn’t easy. The challenge lies in the forward-looking nature of these investments. Unlike other expenses, the impact of R&D on revenue isn’t immediately visible. You need a structured approach to effectively track, monitor, and evaluate your R&D spend.
Step 1: Segment your R&D expenses
You can segment your expenses in two ways. One is to follow the 70-20-10 rule and then tailor your allocation later. With this rule, you categorize your R&D expenses into three strategic buckets:
- Core product maintenance and improvement (typically 70%)
- New feature development for existing products (around 20%)
- Innovation and exploratory projects (approximately 10%)
Another way to segment your expenses is to categorize them by business impact: customer acquisition, revenue expansion, market growth, and retention.
Whichever method you choose, keep in mind these methods should be used as a reference point, not a rigid rule.
The 70–20–10 rule for allocating R&D—sometimes it works, sometimes it doesn’t — Andreessen Horowitz
Step 2: Define ROI of R&D
Next, classify each R&D project as either offensive (growth-driven) or defensive (risk mitigation), and define its payback period.
Offensive bets drive new revenue, while defensive bets are aimed at preventing customer churn or reducing costs.
Understanding these trade-offs helps finance leaders evaluate whether R&D spend aligns with business goals.\
Step 3: Review and adjust budgets
A startup’s R&D priorities should evolve based on market conditions, competition, and internal performance. Having a rigid budget can stifle innovation but a wholly unstructured approach leads to waste.
Teams should review R&D allocations periodically to reset priorities and ensure funds go to initiatives that deliver real value.
Step 4: Track performance metrics
Key indicators such as product development timelines, budget adherence, and engineering efficiency are all important to keep an eye on while monitoring your R&D spend.
Measuring R&D productivity, like revenue generated from new features relative to development costs, will help you assess whether investments are generating any return.
Step 5: Optimize based on outcomes
If R&D spend isn’t driving results, you should refine priorities, reallocate resources, and improve performance tracking.
In some cases, a zero-based budgeting approach, where every expense must be justified from scratch, can help reset and realign R&D investments with strategic objectives.
Make data-driven R&D decisions with Drivetrain
R&D as a % of revenue in SaaS is a key metric that provides a clear, quantifiable measure of how effectively a company invests in innovation. It helps SaaS finance teams benchmark performance, optimize spending, and align investments with growth objectives.
By integrating data-driven insights into R&D decisions, companies gain a deeper understanding of product viability and resource allocation. This enables smarter decisions—whether to double down on high-impact projects or pivot away from underperforming initiatives.
With the right FP&A software—one designed to factor in the complexities inherent in the SaaS business model—finance teams can monitor R&D efficiency in real time, compare spending to revenue impact, and adjust strategies proactively.
Drivetrain offers a host of features that support comprehensive planning, tracking, and analysis of spending in all the areas of your business. With more than 800 integrations, Drivetrain consolidates data from multiple sources to provide granular insights.
The platform is equally intuitive for finance and non-finance users, which makes it easy to collaborate with engineering teams to make sure that all your R&D investments are well-aligned with business goals.
Explore how Drivetrain helps you track R&D spend and other key SaaS metrics.

FAQs
R&D encompasses all the activities associated with building, maintaining, improving, and innovating the products that SaaS companies sell.
For SaaS companies, R&D expenses include:
- Personnel costs: All employee-related expenses for software engineers, research scientists, data analysts, UX designers, and product managers whose job it is to develop, maintain, and/or innovate SaaS products.
- Software development costs: Software development costs in SaaS companies include investment in development tools and frameworks and third-party integrations.
- Cloud infrastructure costs: Cloud computing services and the hardware, software licenses, and tools that enable research and product development. Note that cloud costs associated with the delivery of SaaS are not considered part of R&D but are instead considered part of the cost of goods sold.
- Intellectual property and patent costs: Software and tool licensing costs for development environments, advanced analytics platforms, artificial intelligence research tools, and complex testing frameworks.
SaaS R&D expenses vary significantly based on several factors, including a company's strategy, market, and growth state. For private SaaS companies, the median for R&D spending as a percentage of revenue ranges from 22-31% as compared to around 17% for publicly traded companies.
Like this article?
.svg)

.svg)
.svg)

%20Header.svg)
%20Header.svg)


