
Net Revenue Retention (NRR)
The complete guide for finance teams: Learn how to calculate NRR, interpret the results with real industry benchmarks, and how to improve it.
 Jason Patraj, Solutions Architect - EPM Software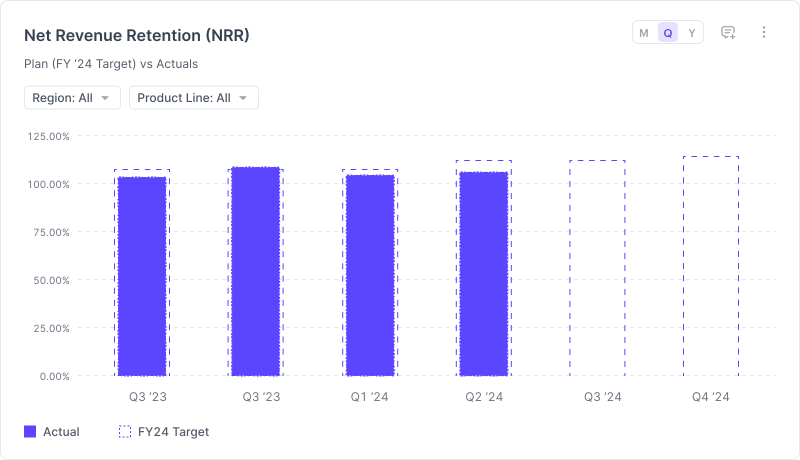
Read TL;DR
- Net revenue retention (NRR) measures how recurring revenue from existing customers changes over time to help teams identify expansion, contraction, and churn.
- Most SaaS companies operate around 100–110% NRR, while top performers reach 110–120% or higher. Benchmarks vary based on factors like pricing model and company size.
- An NRR of 116% over a 12-month period means that if your customer cohort from a year ago were paying you $100, they’re now paying you $116. Your company will grow its revenue by 16% without having to acquire any new customers.
- NRR has a direct impact on growth and valuation. Companies with higher NRR tend to scale more efficiently and command premium valuation multiples.
- A strong headline NRR can sometimes be misleading: strong performance from older cohorts can hide rapid deterioration in newer ones, a pattern that won't show up in your headline number until it's already done significant damage.
- It is important to track gross revenue retention (GRR) in addition to NRR. GRR measures the revenue you retain at the same or lower contract value, which will surface issues such as churn and contraction sooner.
Acquiring new customers can be at least five times more expensive than retaining existing customers. Retaining your existing customer base (by limiting churn and downgrades) and getting a bigger share of their wallet (via expansion and upgrades) is the best way to minimize customer acquisition costs (CAC). Net revenue retention helps you understand how both retention and expansion are working for your business, which can help you improve your overall CAC efficiency and accelerate growth.
Definition
Net revenue retention (NRR), also referred to as net dollar retention (NDR), is the percentage of recurring revenue a SaaS company retains from its existing customers over a specified time period (most commonly a year).


In this guide, you’ll learn how to calculate NRR using a clear, cohort-based approach. You’ll also find data for benchmarking your NRR and everything you need to understand what NRR is really saying about your business, the nuances that can lead to misinterpretation, and the specific levers you can use to improve it.
What is net revenue retention?
Net revenue retention (NRR), also called net dollar retention (NDR), measures the percentage of recurring revenue a SaaS company retains from a specific customer cohort over a period of time, after accounting for expansion revenue from upsells and cross-sells, as well as revenue lost to downgrades and cancellations. It does not include new customer recurring revenue.
The operative word here is "net." NRR captures not just what you kept, but what you grew. That is what separates it from gross revenue retention (GRR), which only measures what you retained at the same or lower contract value.
An NRR above 100% means your existing customer base, on its own, is generating more revenue at the end of the period than it was at the start. In practical terms, you are growing without needing a single new customer.
ARR vs. NRR
Annual recurring revenue (ARR) is the recurring revenue a SaaS company earns each year. NRR measures how well the company retains its customer base and expands revenue from it.
Despite sounding similar, they’re completely different.
ARR measures total annual recurring revenue across all customers, including new ones. NRR doesn’t include new customers, which makes it a narrower, more diagnostic metric: it tells you what is happening within your existing base, independent of acquisition.
Why is net revenue retention important for SaaS companies?
As a key cohort-based SaaS metric, NRR offers critical insights into the growth potential of your existing customers. It reflects your core business health by indicating the rate at which your business would grow if you didn’t add new customers going forward. This makes it one of the five critical metrics used for KPI-based SaaS financial planning and is very useful for figuring out where you’ll land by the end of the year.
Let’s take a more detailed look at why SaaS companies (and investors) care about NRR.
NRR has a cumulative impact on growth
If your company’s net retention rate is above 100% you can be confident that your net revenue from existing customers is compounding on an annual basis. Conversely, if it’s below 100%, you have a problem.
The math makes this clear. At 120% NRR, a $10M ARR base from existing customers becomes $17.3M in three years with no new customer acquisition. At 90% NRR, that same base shrinks to $7.3M. The difference is not cosmetic. At the end of Year 3, the company with 120% NRR has 2.4x the revenue as the company with 90% NRR.
| NRR | ARR at Year 0 | ARR at Year 1 | ARR at Year 2 | ARR at Year 3 |
|---|---|---|---|---|
| 120% | $10M | $12M | $14.4M | $17.3M |
| 90% | $10M | $9M | $8.1M | $7.3M |
High net revenue retention can take the pressure off sales
When your company’s NRR is above 100%, you don’t need to worry as much about making new sales to compensate for churn because your revenue from existing customers is compounding over time.
It also means you don’t have to rely on customer acquisition as your sole growth strategy and can begin exploring additional GTM and growth strategies.
High net revenue retention leads to higher valuations
A high NRR is important to investors because it signals that a company is retaining and expanding its customer base on a net basis efficiently, boosting LTVs, and this compounds its growth. Companies with low NRR must expend significant resources replacing churn, thus losing ground to competitors that retain existing customers well.
It’s also an excellent indicator of a company’s customer success and generally means that the company is doing a good job of controlling its customer acquisition costs (CAC). If your company is growing quickly and valued on growth, NRR offers investors a quick way to value it.
High NRR is also one of the clearest signals of real product-market fit. When customers are not just renewing, but expanding, it usually means the product is delivering enough value to justify a larger footprint in their business.
That’s a very different signal from flat renewals and miles apart from churn. Expansion tells you customers are getting deeper into the product, which is even better than just sticking around.
Valuations often reflect this, especially when inventors believe retention-driven growth is durable. Companies that consistently grow revenue from their existing base tend to trade at a premium, because that growth is more predictable and capital-efficient. A 10-point improvement in NRR has been shown to translate to a 20–30% increase in company valuation, according to one vendor’s analysis of public SaaS data.
How to calculate net revenue retention
Here are three simple steps to calculate net revenue retention:
- Calculate the annual recurring revenue (ARR) of a customer cohort during a previous period (typically, 12 months ago).
- Calculate the current ARR of that cohort.
- Divide the result of the second step by the first. Multiply that number by 100 to express your NRR as a percentage.
The NRR formula
The NRR formula is:
NRR = (Starting ARR + Expansion ARR − Contraction ARR − Churn ARR) ÷ Starting ARR × 100
Where:
- Starting ARR is the annual recurring revenue from a specific cohort at the beginning of the measurement period (typically 12 months ago).
- Expansion ARR is additional revenue from that same cohort generated through upsells, cross-sells, seat additions, or usage growth.
- Contraction ARR is revenue reduction from downgrades, plan changes, or seat reductions within the cohort.
- Churn ARR is revenue lost because customers in the cohort cancelled entirely.
The result is expressed as a percentage. An NRR of 110% means that, from the same cohort of customers you started with, you are collecting 10% more revenue than you were 12 months ago.
Say you had a cohort of customers that paid a combined $2,000,000 in ARR at the start of the year. Over the next 12 months:
- Expansion ARR from upsells and seat additions was $320,000
- Contraction ARR from downgrades was $80,000
- Churn ARR from cancellations was $120,000
NRR = ($2,000,000 + $320,000 − $80,000 − $120,000) ÷ $2,000,000 × 100 = 106%
This means the existing customer base grew by 6%, net of all losses. Sales added no new customers to this equation. The 6% came entirely from within the existing base.
Monthly NRR vs. annual NRR
NRR is most commonly measured on an annual basis using ARR cohorts, but some finance teams track it monthly using MRR. The two produce different numbers and are not directly comparable.
Monthly NRR tends to show more volatility because a single large expansion or cancellation can swing it significantly.
Annual NRR smooths that volatility and is the standard for board reporting and investor conversations. If your team uses both, it’s important to be explicit about which one you are reporting to avoid misinterpretation.
What is a good net revenue retention rate?
Obviously, the higher your NRR, the better. However, benchmarking NRR requires context. This section provides NRR benchmarks from various perspectives that will help you evaluate your NRR in a more comprehensive way.
NRR by company size
The table below shows NRR results from Benchmarkit’s B2B SaaS Performance Metrics Benchmarks for 2025, which compiled data from 563 mostly private SaaS companies (97.8% private, 2.2% public).
| ARR range | Bottom quartile | Median | Top quartile |
|---|---|---|---|
| Less than $1M | 95% | 100% | 105% |
| $1M – $5M | 98% | 112% | 120% |
| $5M – $20M | 93% | 101% | 109% |
| $20M – $50M | 92% | 102% | 111% |
| $50M – $100M | 101% | 102% | 108% |
| More than $100M | 92% | 97% | 102% |
NRR benchmarks compiled by High Alpha from 800+ companies for its 2025 SaaS Benchmarks Report are shown in the following table. While the mix of private vs. public companies is not clear in the report, the results are largely similar to those published by Benchmarkit.
| ARR range | Bottom quartile | Median | Top quartile |
|---|---|---|---|
| Less than $1M | 95% | 100% | 105% |
| $1M – $5M | 98% | 112% | 120% |
| $5M – $20M | 93% | 101% | 109% |
| $20M – $50M | 92% | 102% | 111% |
| $50M – $100M | 101% | 102% | 108% |
| More than $100M | 92% | 97% | 102% |
NRR by average contract value (ACV)
Median NRR data reported by SaaS Capital in 2025 shows that companies with ACVs above $12,000 tend to have a higher NRR.
| ACV range | Median NRR |
|---|---|
| Less than $12K | 98% |
| $12K – $25K | 103% |
| $25K – $50K | 102% |
| $50K – $100K | 104% |
| $100K – $250K | 102% |
| More than $250K | 106% |
The data from Benchmarkit shows similar results, with median NRR exceeding 100% for companies with ACVs in the $10K–$25K range. While NRR appears to be broadly similar across all ACV ranges, in the top quartile, companies with higher contract values show stronger NRR.
This makes intuitive sense, as higher ACVs are typically associated with enterprise customers. Enterprise customers usually have more room to grow over time (more seats, higher usage, etc.), and this expansion increases NRR. They also churn less frequently because once a large company has hundreds of users, integrations, and reports built on a product, leaving is a massive project.
| ACV range | Bottom quartile | Median | Top quartile |
|---|---|---|---|
| Less than $1K | 90% | 100% | 102% |
| $1K – $5K | 89% | 99% | 105% |
| $5K – $10K | 90% | 100% | 108% |
| $10K – $25K | 95% | 101% | 112% |
| $25K – $50K | 89% | 105% | 112% |
| $50K – $100K | 96% | 104% | 116% |
| $100K – $250K | 98% | 102% | 114% |
| More than $250K | 96% | 107% | 115% |
NRR by go-to-market (GTM) motion
GTM motions influence NRR and affect how customers are acquired and managed, which indirectly influences NRR.
From the figure below, there doesn’t seem to be much of a difference across the different GTM motions in terms of the median NRR.

NRR by go-to-market (GTM motion).
What’s interesting here is the distribution.
NRR associated with a product-led motion has the tightest range (100%–105%) with every quartile 100% or higher. This suggests that even weak performers are net positive but hit a ceiling at only 105%. This narrow, modestly positive range may be explained by the self-serve nature of product-led companies, which may be limiting both churn (low friction makes it easy for customers to stay) and expansion (there’s no sales motion to drive upsells).
The NRR for sales-led GTM motion has the widest range (95%–111%), and there’s more variance in both directions relative to the median. This may be driven by variability across companies in terms of the performance of their sales and CS teams. Both can drive strong expansion when they’re working well, but they can also create more exposure to churn and contraction when they’re not.
Hybrid GTM motions have the highest NRR at the median and top quartile, which may reflect their ability to capture the expansion upside of a sales-led motion.
NRR by pricing model
Pricing models determine how expansion and contraction are measured and when they occur. As a result, they have a direct effect on NRR.
Benchmarkit’s NRR data for different pricing models suggests that hybrid models have a strong advantage with regard to NRR.

NRR by pricing model.
The apparent advantage for hybrid pricing models may be due to the combined impacts that both subscription-based and usage-based models have on growth:
- Expansion ARR is higher because the hybrid model gives you two expansion mechanisms instead of just one. Expansion doesn't require the sales/customer support team like a subscription-based model does, and it isn’t limited to consumption growth like a purely usage-based model. Hybrid companies get both.
- Contraction is a bit more limited in hybrid models: This is because the subscription component creates a built-in floor. Even if a customer’s usage drops, they’re still committed to the base subscription for the duration of the contract. In a pure usage-based model, revenue moves up and down with consumption, so any drop in usage directly hits NRR.
- Churn tends to be lower: Subscriptions create defined intervention points before renewal and opportunities to proactively take steps to retain the customer. This lowers renewal friction. In usage-based models, customers can gradually stop using the product without a formal cancellation, which makes churn harder to detect. Subscriptions or hybrid models create more defined opportunities to act before revenue is lost.
The impact on NRR becomes clear when you think about these dynamics in the context of the NRR formula: The numerator is larger (more expansion paths) and less exposed to reduction (contraction floor, lower churn) relative to the same starting ARR in the denominator.
GRR vs. NRR
GRR and NRR measure fundamentally different things. Knowing how to use them together is where the analytical value lies.
The GRR formula
It shows how well your company retains its customers over a given time period. If all of your customers from the year-ago cohort renew their contracts today (assuming they’re on annual contracts with no cancellations or downgrades), your GRR will be 100%.
Here’s how to calculate it:
GRR formula: (Starting ARR − Contraction ARR − Churn ARR) ÷ Starting ARR × 100
GRR includes account churn but excludes expansion revenue, while NRR includes both. As a result, unlike NRR, the maximum value GRR can have is 100%. This distinction matters because NRR can look healthy while GRR is telling a different story.
Consider two companies, both reporting 110% NRR:
- Company A has a GRR of 93%. Most of its customers are renewing, and expansion is building on a stable base.
- Company B has a GRR of 78%. A significant portion of its revenue base is churning each year, and expansion is doing the heavy lifting to offset those losses.
Even though both companies look identical, they’re actually in very different positions. Company A has a manageable retention problem, while Company B’s problem is structural. Company B is relying on expansion to replace revenue that’s constantly leaking out of the business.
This is an important distinction. Presenting 110% NRR to the board without the context of GRR creates a false sense of security, especially if expansion is masking the high churn.
GRR below 80% is generally a warning sign because expansion must offset substantial revenue leakage. At that level, the business is losing a meaningful portion of its revenue base before expansion is even considered, and no amount of upsell can reliably compensate for that.
When to use each metric
Both retention rate metrics provide insights into your business. The choice of which metric to use really just depends on what you want to know.
If you want to know whether your company is keeping its customers happy with its products and customer service, then GRR is a good choice because it measures how much revenue you’re losing to customers leaving and downgrading their subscriptions (churn and contraction).
On the other hand, if you’re looking to understand more holistically what’s happening with your customer base, then NRR is a better metric for understanding changes in net revenue. This is because it takes into account not only the negative impact of churn and contraction, but also the positive impacts of price increases, upsells and cross-sells.
Net revenue retention nuances every finance professional should know
NRR is easier to calculate than interpret. It can look healthy while still masking multiple underlying issues. The nuances below are what separate a surface-level read from a true understanding of what’s happening in your customer base.
Aggregating NRR can hide a deteriorating business
A healthy-looking NRR can sometimes be misleading. If older customer cohorts have strong retention and expansion, they can carry the whole number, even as newer cohorts start to churn or contract at much higher rates.
Think about it. The older cohorts dominate the aggregate figure simply because they’re larger in dollar terms. The impact from newer cohorts gets diluted until their performance becomes large enough to move the NRR figure, which can often take several quarters.
As a result, your NRR looks stable or even strong, while the underlying trend is moving in the wrong direction. The only way to catch this early is to track NRR by cohort. Tracking NRR by customer acquisition year, for example, makes it immediately clear whether newer cohorts are performing in line with older ones or falling behind. This is exactly why many finance teams track and plot NRR over time at the cohort level instead of relying on a single aggregate number.
Including new customers acquired during the measurement period in your starting cohort creates another problem. This inflates NRR because it mixes retention with new acquisition, and when this happens, the resulting NRR value doesn’t accurately reflect how well you're retaining existing revenue. NRR should only measure revenue from customers you had at the start of the period you’re tracking.
NRR is a lagging indicator by design
NRR tells you what’s already happened. It measures how a cohort performed over the past 12 months, which means any deterioration in retention or expansion takes time to show up in NRR. By the time your annual NRR starts to decline, the underlying issues have usually been building for several months.
Monthly NRR can help you identify changes earlier, but it’s more volatile. A single large expansion or cancellation can move the number significantly, making it harder to interpret in isolation.
The practical implication is straightforward—NRR should not be your first signal that something’s wrong. By the time an issue impacts NRR, you’re likely already behind. Instead, you should rely on leading indicators like product usage trends or engagement levels to identify problems before they show up in NRR.
Not all companies define NRR the same way
At first glance, NRR looks like a standardized metric, but it’s not.
Most definitions follow the same basic structure: starting revenue, plus expansion, minus churn and contraction. However, there is meaningful variation in how companies calculate and interpret NRR. This can be seen in the Securities and Exchange Commission (SEC) filings of public SaaS companies, which show that many make adjustments to the standard NRR formula.
The differences usually come down to what gets included as “expansion,” how cohorts are defined, and the time period used for measurement.
For example, some companies treat price increases as expansion, while others don’t. Revenue from new products sold into an existing account may be counted as expansion in one company and as a new logo in another. Even the choice between monthly and annual cohorts can change the reported number. They can’t be compared directly, so pick one and be consistent.
These differences make cross-company comparisons less reliable. An NRR of 108% at one company isn’t always directly comparable to 105% at another. That’s why it’s worth checking that you’re working with figures derived using comparable definitions when benchmarking NRR or presenting it to your board.
It's also worth reconciling your NRR output with your underlying ARR movements. If your calculated NRR doesn't align with the expansion, churn, and contraction visible in your ARR bridge, there's likely a data or definitional issue that needs to be resolved.
High NRR can coexist with high logo churn
If you look at the NRR formula, you’ll notice that there’s no place for customer count in that calculation. That means a company can lose a large number of smaller customers while retaining and expanding a handful of larger accounts and still reporting strong NRR. From a revenue standpoint, the business is healthy, even with a declining customer base.
Whether this is seen as a problem depends on the business model. For enterprise-focused companies, this isn’t a big problem. Growth is inherently concentrated in a smaller number of high-value accounts, and expansion within those accounts drives the majority of revenue. But for companies that rely on a broad customer base, whether for product feedback or community-driven growth, high churn creates long-term risks even if NRR looks strong today.
This is why NRR should always be viewed alongside logo retention rate. Looking at both revenue retention and customer retention together gives you a more complete picture of what’s actually happening in the business.
Usage-based pricing changes how expansion is counted
Expansion is relatively straightforward in a traditional seat-based model. Customers just upgrade plans or add seats, so revenue increases are clearly tied to deliberate buying decisions.
Expansion happens more organically in usage-based models. Revenue increases as customers use more of the product, even without any formal upsell motion. This can drive strong NRR during a growth phase, especially when usage scales quickly across the customer base.
The tradeoff here is that the same mechanism works in reverse. If usage declines, revenue declines just as naturally. That makes NRR sensitive to changes in customer behavior and often more volatile.
That’s why NRR in usage-based businesses needs to be interpreted over longer time horizons. Looking at rolling periods of multi-quarter trends provides a more reliable view than looking at the NRR at any specific point in time.
How to improve net revenue retention?
NRR is one of the most important growth levers for any SaaS company and arguably one of the most cost-effective because it typically costs less to keep an existing customer than it does to acquire a new one. It’s also a high-priority metric to track because of its cumulative impact on growth.
The revenue from existing customers compounds year after year. As new customers are added to the base, this compounding effect is applied to a larger base each period.
Research published by SaaS Capital bears this out, showing that higher NRR consistently corresponds with higher growth rates and that 100% NRR appears to be a meaningful threshold. Above that point, companies tend to grow faster. While the rate of growth differs, the relationship holds.

Changes in median growth rates as NRR increases.
So, how do you improve NRR?
That requires working both sides of the equation: reducing the revenue you lose, and growing the revenue you keep.
1. Drive expansion revenue systematically
Most companies treat expansion as something that happens, but there’s a better way. Treat it the way you treat sales. Build a pipeline, track it, make forecasts, and proactively strive to achieve desired outcomes.
The first step is to break expansion down into its core levers:
- Upsells: More seats or higher tiers
- Cross-sells: Additional products
- Usage growth: Broader usage by existing customers
Each of these behaves differently and needs its own motion. Once you model them explicitly, you’ll see where the real opportunity sits within your existing customer base.
This is where frameworks like the bowtie model come in handy. The bowtie model maps the full customer lifecycle, helping you move beyond the traditional funnel that ends in sales. It makes expansion and retention visible and measurable, rather than leaving them as byproducts of customer success efforts.
With the bowtie model, you’re essentially treating expansion as a second pipeline. You identify which existing customers can grow, estimate how they might expand, and track when that additional revenue is likely to come in. The result? Expansion stops being reactive and becomes a planned and repeatable motion.
2. Reduce churn and contraction
This is your starting point when you begin putting effort into improving NRR. Expansion usually gets most attention, but your NRR is ultimately anchored by how much revenue you’re losing. If churn and contraction are high, you’re working uphill, and no amount of upsell will consistently make up for a shrinking base.
Churn risk shows up early in most SaaS businesses. The first 60–90 days after onboarding are usually when things either go right or wrong. If customers don’t see value quickly, they either leave or start scaling back.
That’s why you must watch for the early signals. There are several ways to get ahead of churn and contraction. Let’s look at those now.
Watch for leading indicators of churn and contraction
Keep your eyes open for drops in product usage, fewer active users, slower adoption of key features, and other leading indicators of churn and contraction. The earlier you catch them, the more room you have to intervene.
In addition, you can use customer health scoring as a leading indicator. Customer health scores help you spot problems before they show up in NRR.
A health score is just a way to track how customers are using your product. For example, if usage drops or key features aren’t being used, that’s usually a sign they might leave later. If you catch this early, you can step in and fix the issue before it leads to churn.
Use the bowtie model to track changes in customer behavior
Using bowtie funnel metrics can help you track changes in customer behavior in several different ways across the customer lifecycle, providing an early warning signal for potential churn.
If conversions on the right side of the funnel, which tracks retention and expansion, begin to decline, there’s a good chance your future NRR will fall too.
Implement quarterly business reviews (QBRs)
QBRs are one of the most effective tools for staying ahead of churn for mid-market and enterprise accounts, particularly for those with ACV above $20K.
In a QBR, the dedicated account manager and the client meet to assess how well the product is achieving the client’s goals, discuss any escalations, and talk about expansion use cases.
The QBR also helps the account manager better understand the overall health of the business relationship, which can reveal opportunities to improve it if needed. Taking the pulse of the relationship to proactively address churn, combined with the expansion conversation, makes QBRs useful on both sides of the NRR equation simultaneously.
QBRs can also surface organizational changes, something you can only learn through conversation. For example, say your product champion, the head of finance who bought your product, is leaving the company; if you’re holding QBRs, you’ll probably find out about that early.
That gives you time to start building relationships with other potential champions in the company before the new head of finance arrives with his or her own vendor preference. The accounts most at risk of unexpected churn are often those where the relationship lives entirely with one person.
Optimize your customer success (CS) staffing ratio
Finance teams need to work closely with the CS leaders to maintain the right ratio of customer success managers to customers.
The right CSM-to-customer ratio depends on several factors: the complexity of your product, the segment you're serving, the ACV of each account, and how much proactive engagement your retention and expansion goals require.
Getting this wrong in either direction creates problems. Too few CSMs and accounts get neglected; too many and the cost structure undermines the NRR gains you're trying to protect.
When the ratio is right, CSMs can stay ahead of at-risk accounts. They can show up to QBRs better prepared to spend time identifying expansion opportunities rather than firefighting.
When your CSMs are able to shift from reactive support to proactively working with customers to help them get the most out of your product, they become key drivers of NRR.
3. Build product stickiness into the business model
Customers are much less likely to leave when they rely on your product to do their daily work. The goal is to move from a “nice-to-have” tool to something they actually depend on.
This usually happens when your product becomes part of how they work. This can happen in several ways, such as through:
- Integrations with their core systems
- Features that replace existing processes
- Usage across multiple teams
The more embedded your product is, the harder it is to switch.
Customers who use your product more deeply tend to retain and expand more. In fact, you can see this in your data by comparing customers who have integrated your product into their systems and customers who haven’t. If the first group has a higher NRR, it shows that deeper usage leads to better retention and expansion.
4. Leverage technology to make tracking NRR easier
Tracking NRR sounds pretty straightforward, but ask anyone who has been using spreadsheets to track NRR, and you’ll see how messy that process can get.
Think about it. You’re manually pulling data from multiple systems and updating cohorts, and then trying to reconcile expansion and churn across different sources. Even small errors in this tedious process can throw off the NRR figure. And by the time you update everything, the data is already outdated.
Spreadsheets also make it harder for you to dig deeper into the data. Imagine trying to break NRR down by cohort or segment on a spreadsheet. This would require you to build and maintain complex models that are hard to scale and audit.
What you need to effectively track NRR is FP&A software that pulls data from your existing systems into a model.
Once it has all the required data, the FP&A tool calculates and automatically updates that figure in real time. You can analyze performance across cohorts and time periods with far less effort, spending less time on data prep and more time understanding the drivers of your NRR.
Drivetrain natively supports the entire process of tracking NRR. Since executing the tracking process requires minimal effort, you can move from quarterly NRR reporting to monthly. More frequent reporting helps you find problems sooner and gives you more room to intervene before the problem escalates.
About the author

Jason Patraj
Solutions Architect - EPM Software
Jason Patraj is a Solutions Architect with a BBA in Finance and over a decade of hands-on experience implementing enterprise performance management (EPM) and FP&A software for finance teams. With over seven years at Delbridge Solutions, where he served as Principal Solutions Architect and Project Lead, Jason has helped over 200 organizations design and implement financial planning systems. At Drivetrain, he focuses on FP&A solutions architecture and writes about software implementation best practices, system design, and how finance teams can leverage technology to improve their planning processes.
FAQs
What is NRR in SaaS?
Net revenue retention (NRR) is a key SaaS metric that shows the percentage of recurring revenue retained from existing customers over a defined period of time.
Does Net Revenue Retention include new customers?
No, NRR excludes new customer revenue.
Why is NRR important for SaaS companies?
NRR shows how well your business grows from existing customers, which makes it a key figure for any business that wants to track revenue health and predictability. A high NRR means customers are sticking around and spending more, while a low NRR means you’re losing revenue and are reliant on new sales to compensate for it. NRR also impacts growth and valuation. Companies with a high NRR typically tend to scale more efficiently and be more valued by investors.
What is the difference between GRR and NRR?
NRR includes expansion revenue from upsells and cross-sells, so it can exceed 100%. GRR excludes expansion and captures only what you retained at the same or lower contract value. It is capped at 100%. NRR gives you the full picture of customer base economics; GRR isolates your retention floor. You need both to understand whether your NRR is genuinely healthy or being propped up by aggressive upselling against a weak retention base.
What is a good NRR for a SaaS company?
A good NRR depends on your company’s size, customer segment, and pricing model, but you can take 100% as a general baseline. Anything below 100% means revenue is shrinking. Top-performing SaaS companies typically have their NRR above 110%. Similarly, enterprise and hybrid pricing models tend to have higher NRR, while SMB-focused businesses usually operate closer to 100%. The key is to benchmark your NRR against similar companies and track how it’s trending over time.
Can NRR be above 100%?
Yes. An NRR above 100% means expansion revenue from existing customers more than offsets all contraction and churn. At 110% NRR, for example, a $10M ARR base grows to $11M from the same customers alone, before any new customer acquisition. This is sometimes called "net negative churn": the existing base is a growth engine, not just a retention challenge.
How often should NRR be calculated and reported?
For most companies at Series A and beyond, NRR should be calculated monthly and reported quarterly. The monthly calculation allows your team to identify cohort-level trends early; the quarterly report is the standard for board and investor communication. Annual NRR is what most fundraising discussions reference, but it is the least sensitive to recent changes.
Why does NRR vary so much across different companies?
NRR varies because it depends on how a business is structured, customer segment (enterprise vs SMB), pricing model, and go-to-market motion, among other things, because all of them influence how much customers expand or churn. Companies with larger contracts or hybrid pricing often see higher NRR due to more expansion opportunities. On top of that, companies don’t always calculate NRR the same way, which is why direct comparison is tricky. That’s why it’s best to benchmark against similar companies and understand how the metric is defined.
How can a company with high NRR still be struggling?
High NRR combined with low GRR signals a company papering over a churn crisis with expansion. High NRR combined with severe logo churn means the company is consolidating revenue into fewer large accounts, which increases concentration risk. And high NRR from legacy cohorts can mask rapidly deteriorating new cohort performance. These are the cases where aggregate NRR gives a false sense of health, and cohort-level analysis is the diagnostic tool that surfaces the real picture.
How does Drivetrain help teams track NRR more effectively?
Drivetrain removes the manual work required to track NRR on a spreadsheet. It connects directly to your billing, CRM, and other systems to pull required data and calculate NRR automatically. The data on Drivetrain is always up-to-date and can be used to analyze NRR specifically for a cohort or product without rebuilding models each time. This allows you to identify changes early and understand key drivers impacting your NRR.
Abacum vs. Mosaic vs. Drivetrain: What level of technical expertise is required for each platform?
Abacum comes with a learning curve for complex builds. It also requires more technical fluency for advanced reporting or custom modeling. Mosaic is easier for basic planning, but becomes more technical when your needs move beyond the provided templates. Both may require IT or FP&A power users to build and maintain advanced models. On the other hand, Drivetrain is designed to keep complex modeling accessible, which significantly reduces the need for technical specialists.
Explore more related metrics
View allPass-through Costs
Pass-through costs are expenses you incur on behalf of customers and pass them along at the time of billing, typically at or near the actual cost. In most cases, these costs are associated with third-party goods or services that are tied to a specific client or project. The primary goal of pass-through costs is reimbursement rather than value creation. While pass-through costs are typically billed at or near cost, companies may charge an explicit and separately disclosed markup or handling fee depending on contract terms.
Pipeline Coverage Ratio
Pipeline coverage ratio, or pipeline-to-quota ratio, provides sales managers with a view of how potential deals compare to their revenue targets. It’s calculated to determine how much ARR is accounted for in the unweighted pipeline compared to the new ARR goal.
Quota Attainment Rate
Sales quota attainment (also known as quota achievement rate or sales goal attainment) measures the percentage of sales targets achieved by sales representatives or teams within a specific period. Quota attainment helps companies evaluate individual and team performance, forecast revenue, and optimize their sales strategy.
Remaining Performance Obligation (RPO)
RPO or remaining performance obligation is the sum of deferred revenue (advance payments for services not yet delivered) plus backlog (the amount of money contracted but not invoiced).
Research and Development as a Percentage of Revenue (R&D%)
Research and development (R&D) as a percentage of revenue is calculated as the total cost of R&D (tech teams salaries, benefits, cost of their tools and equipment) divided by revenue.
Return on Ad Spend (ROAS)
Return on ad spend (ROAS) measures the revenue generated per dollar spent on advertising, expressed as a ratio of revenue to ad spend.
Become the strategic partner your business needs.
Fewer spreadsheets, faster planning, better decisions.