.svg)
Spend your time analyzing reports, not just building them.
Drivetrain builds your board, investor, and internal reports automatically from your source data. Get back the days you lose to manual prep, and focus on helping your business make better decisions.


Reporting shapes every decision,
yet it's your most manual work
Automate financial reporting so you can focus on driving decisions
Remove the manual data assembly
work from reporting.
Drivetrain pulls real-time data from your ERP, CRM, and other systems. The native consolidation module automatically rolls up entities and currencies.
Use AI to clean, transform, and classify messy data, and flag anomalies before they reach your report, so you start with numbers you can trust.
.webp)
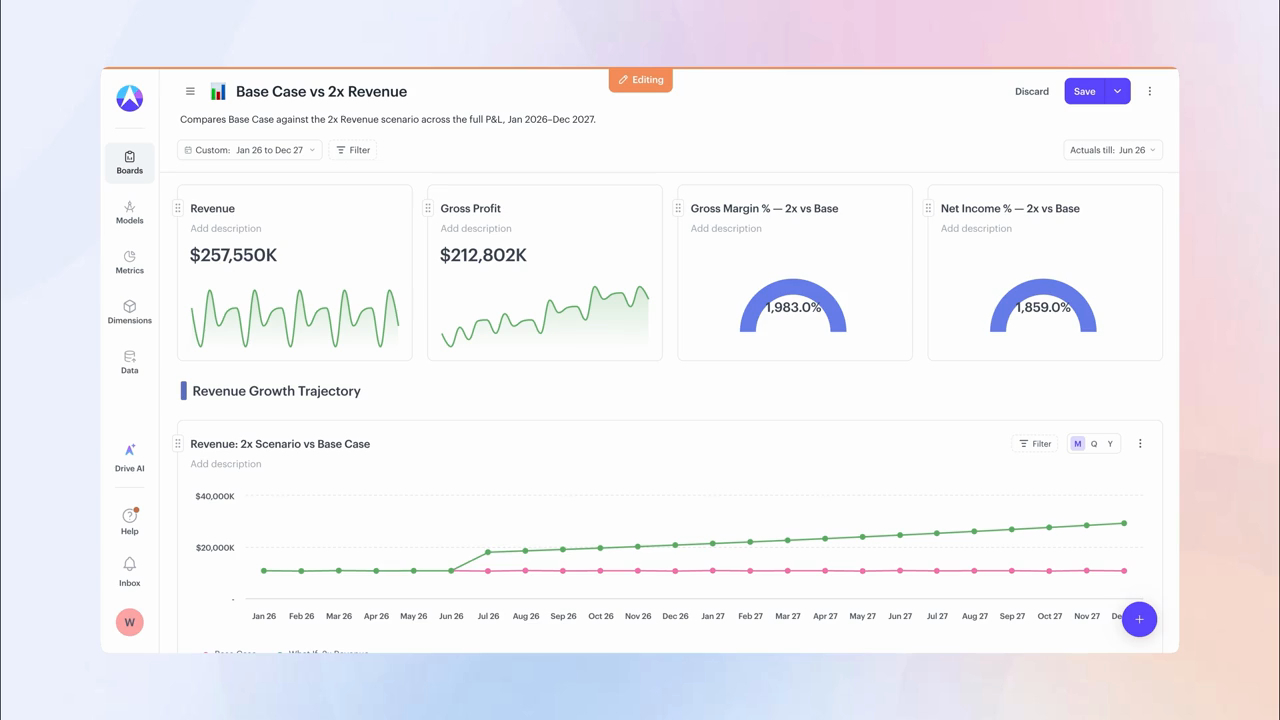
Financial reports that are always
board-ready.
Build custom financial reports in the format your board and investors expect. No more wrangling templates or rebuilding the same report every time.
Present from Drivetrain, or use the Excel plugin to keep your board materials up to date. Schedule and share view-only reports so your board always sees the latest numbers.

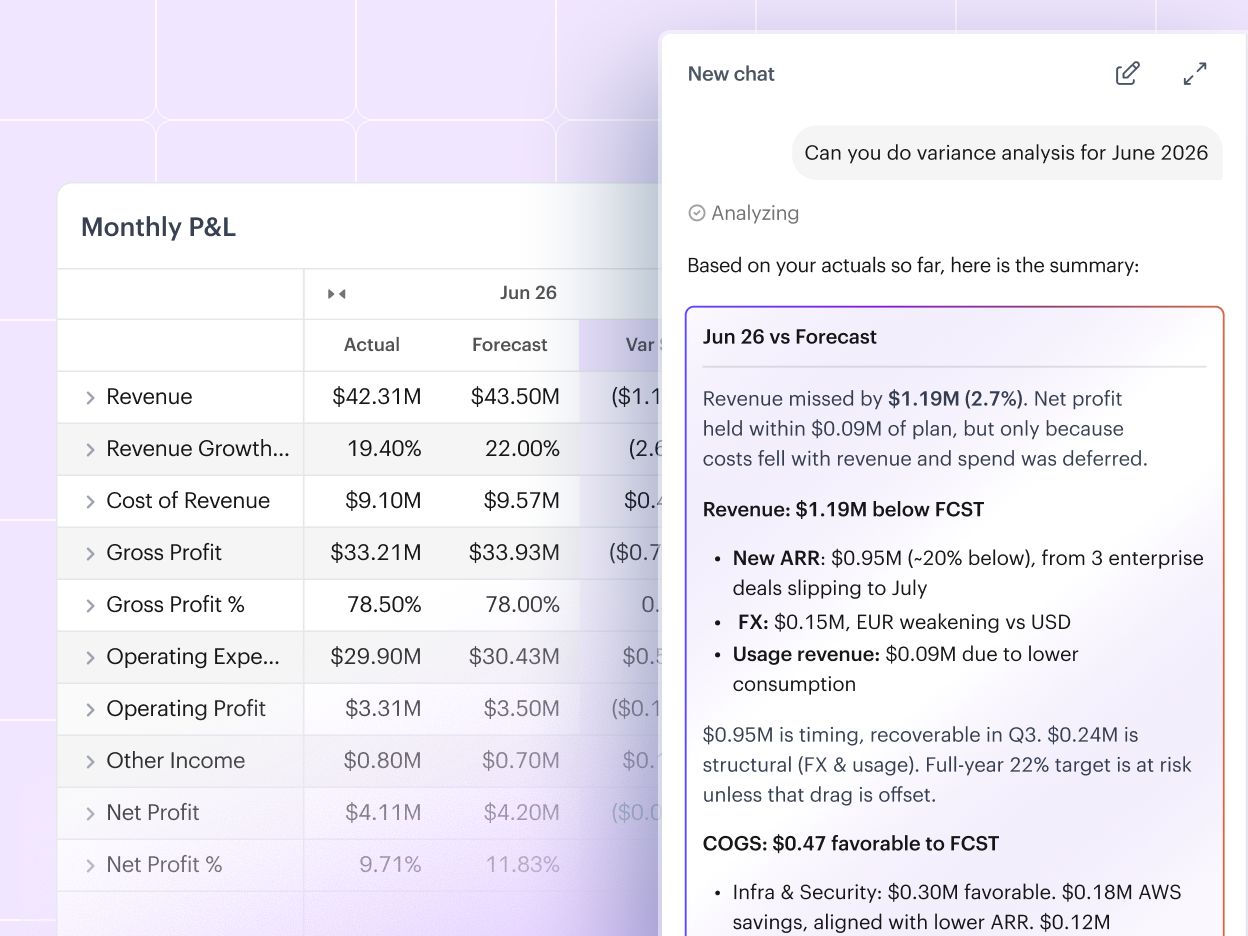
Answer “what moved and why”
in minutes.
Slice the data by any dimension and drill all the way down to the transaction level to identify the root cause.
Or even better, use AI to run the budget vs. actuals analysis, identify the exact drivers behind each variance, and draft the commentary for you.
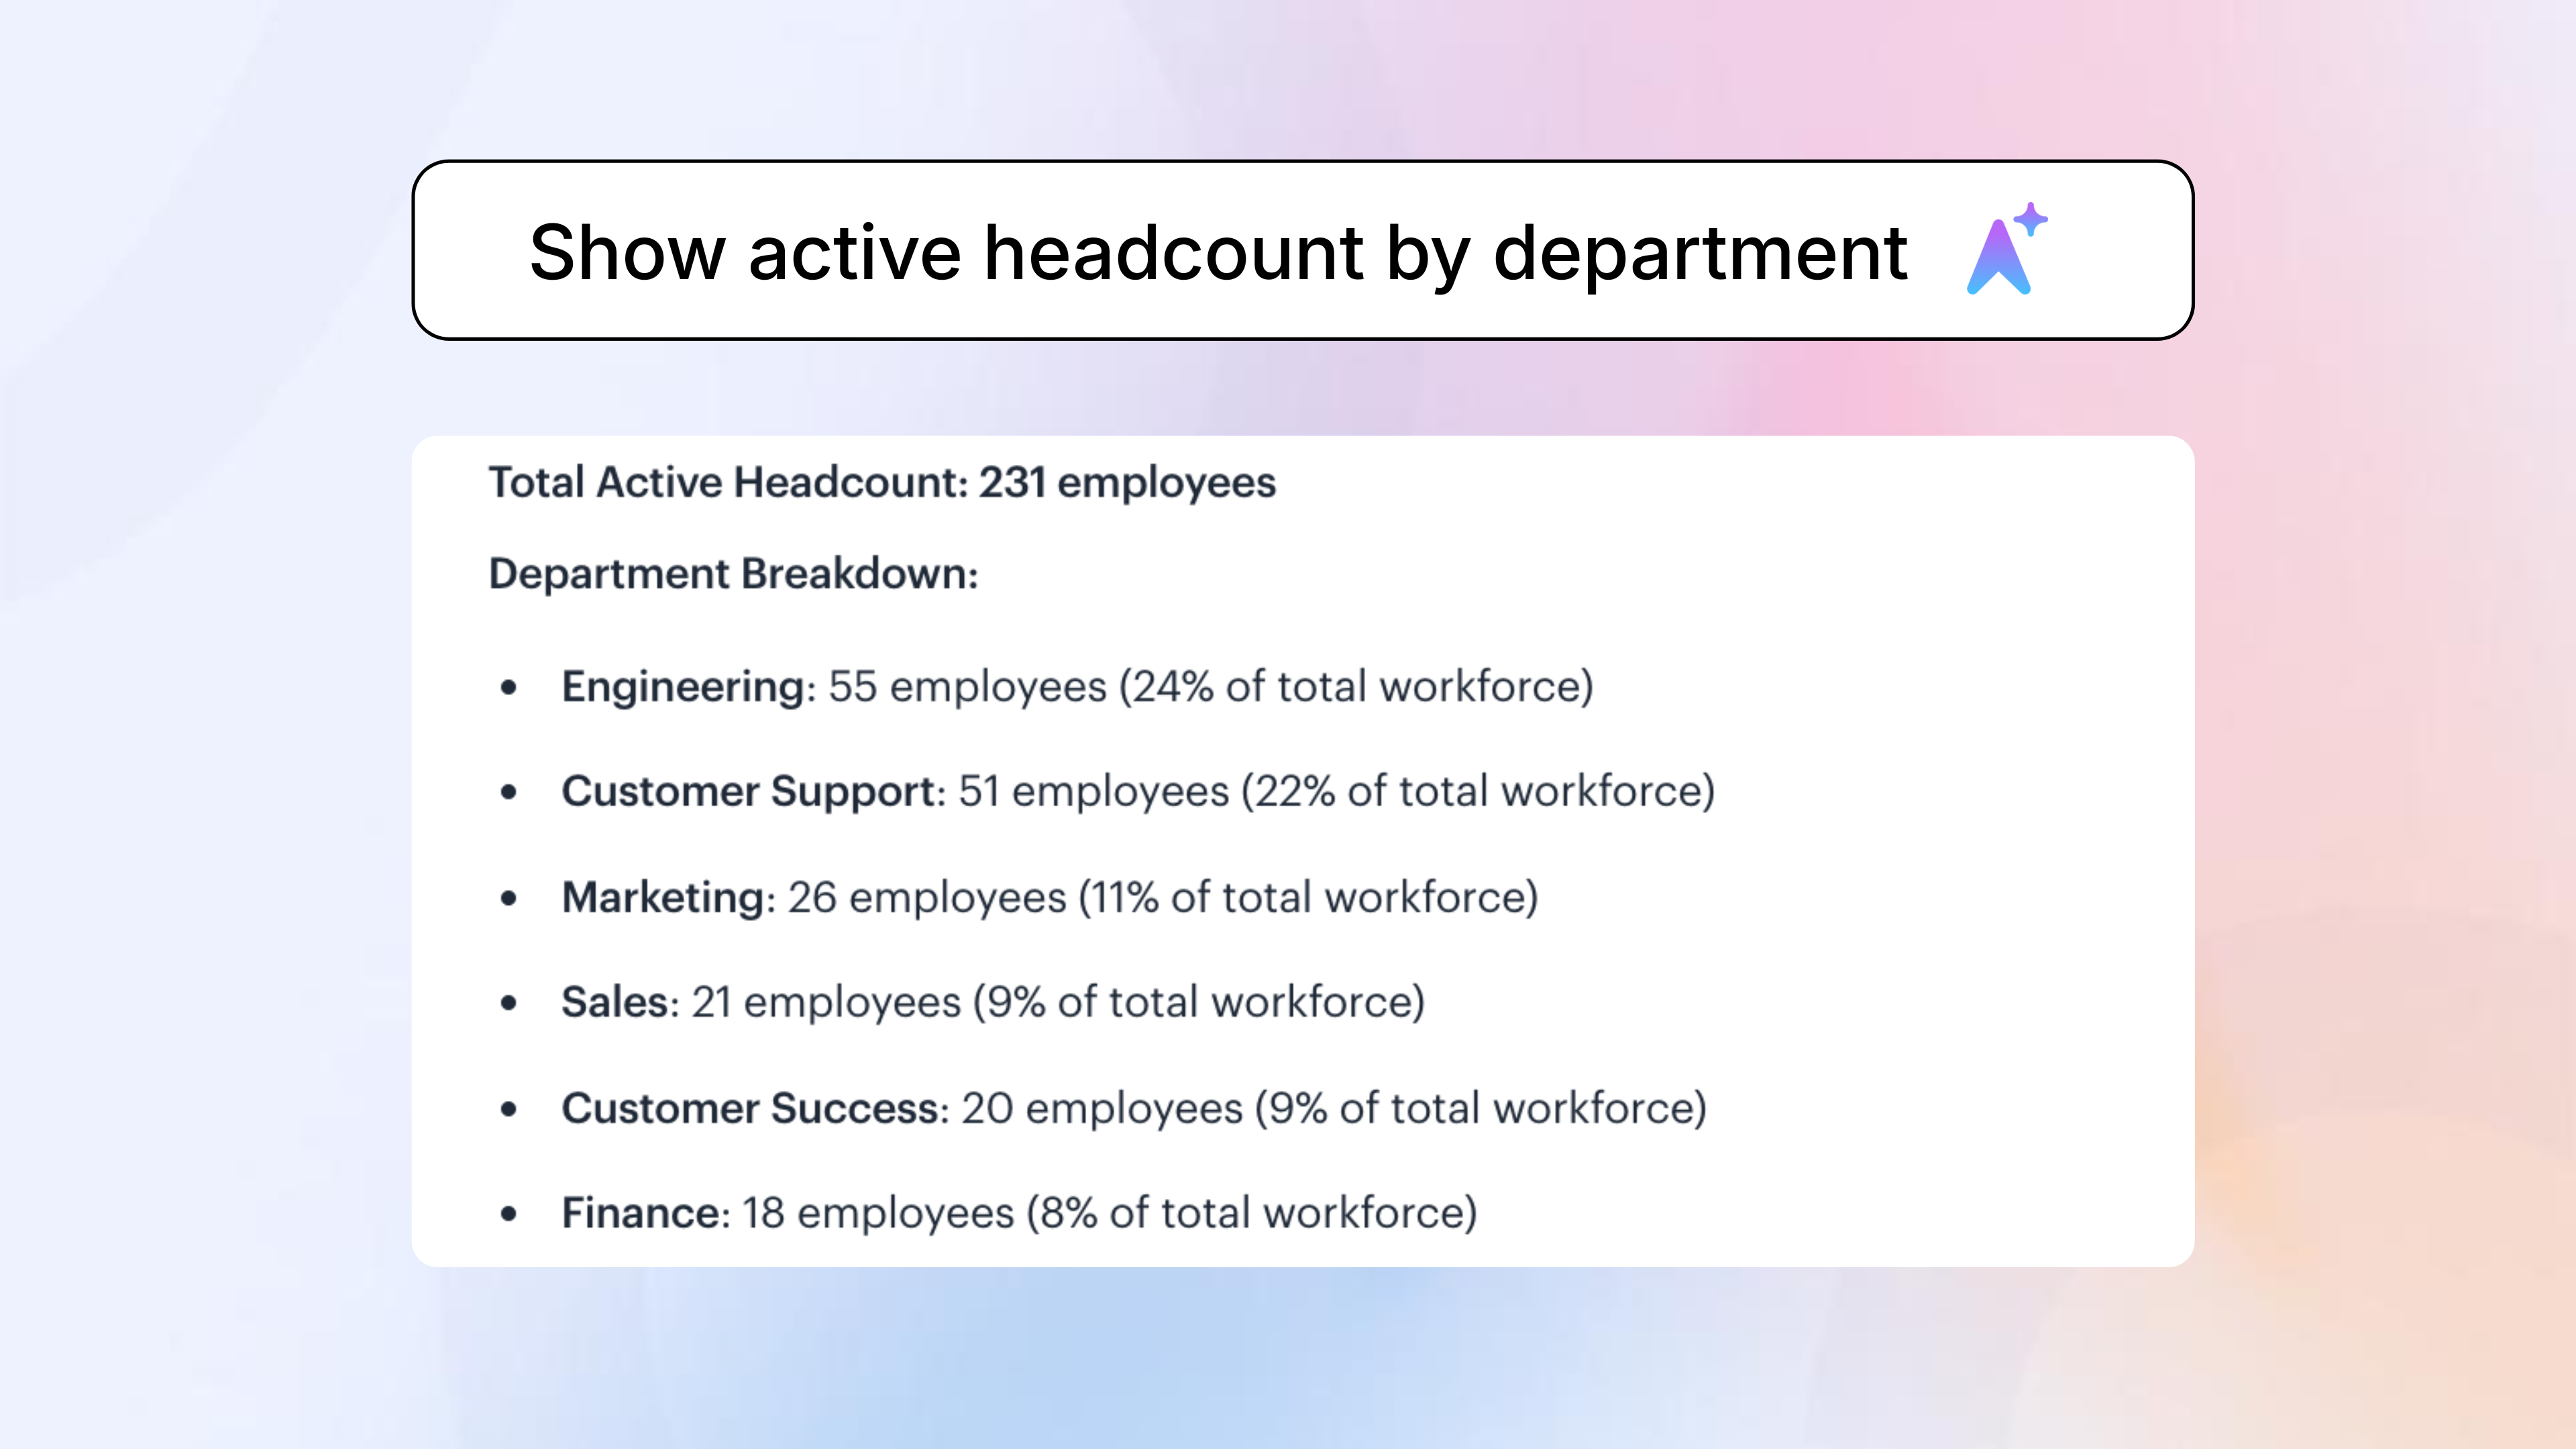
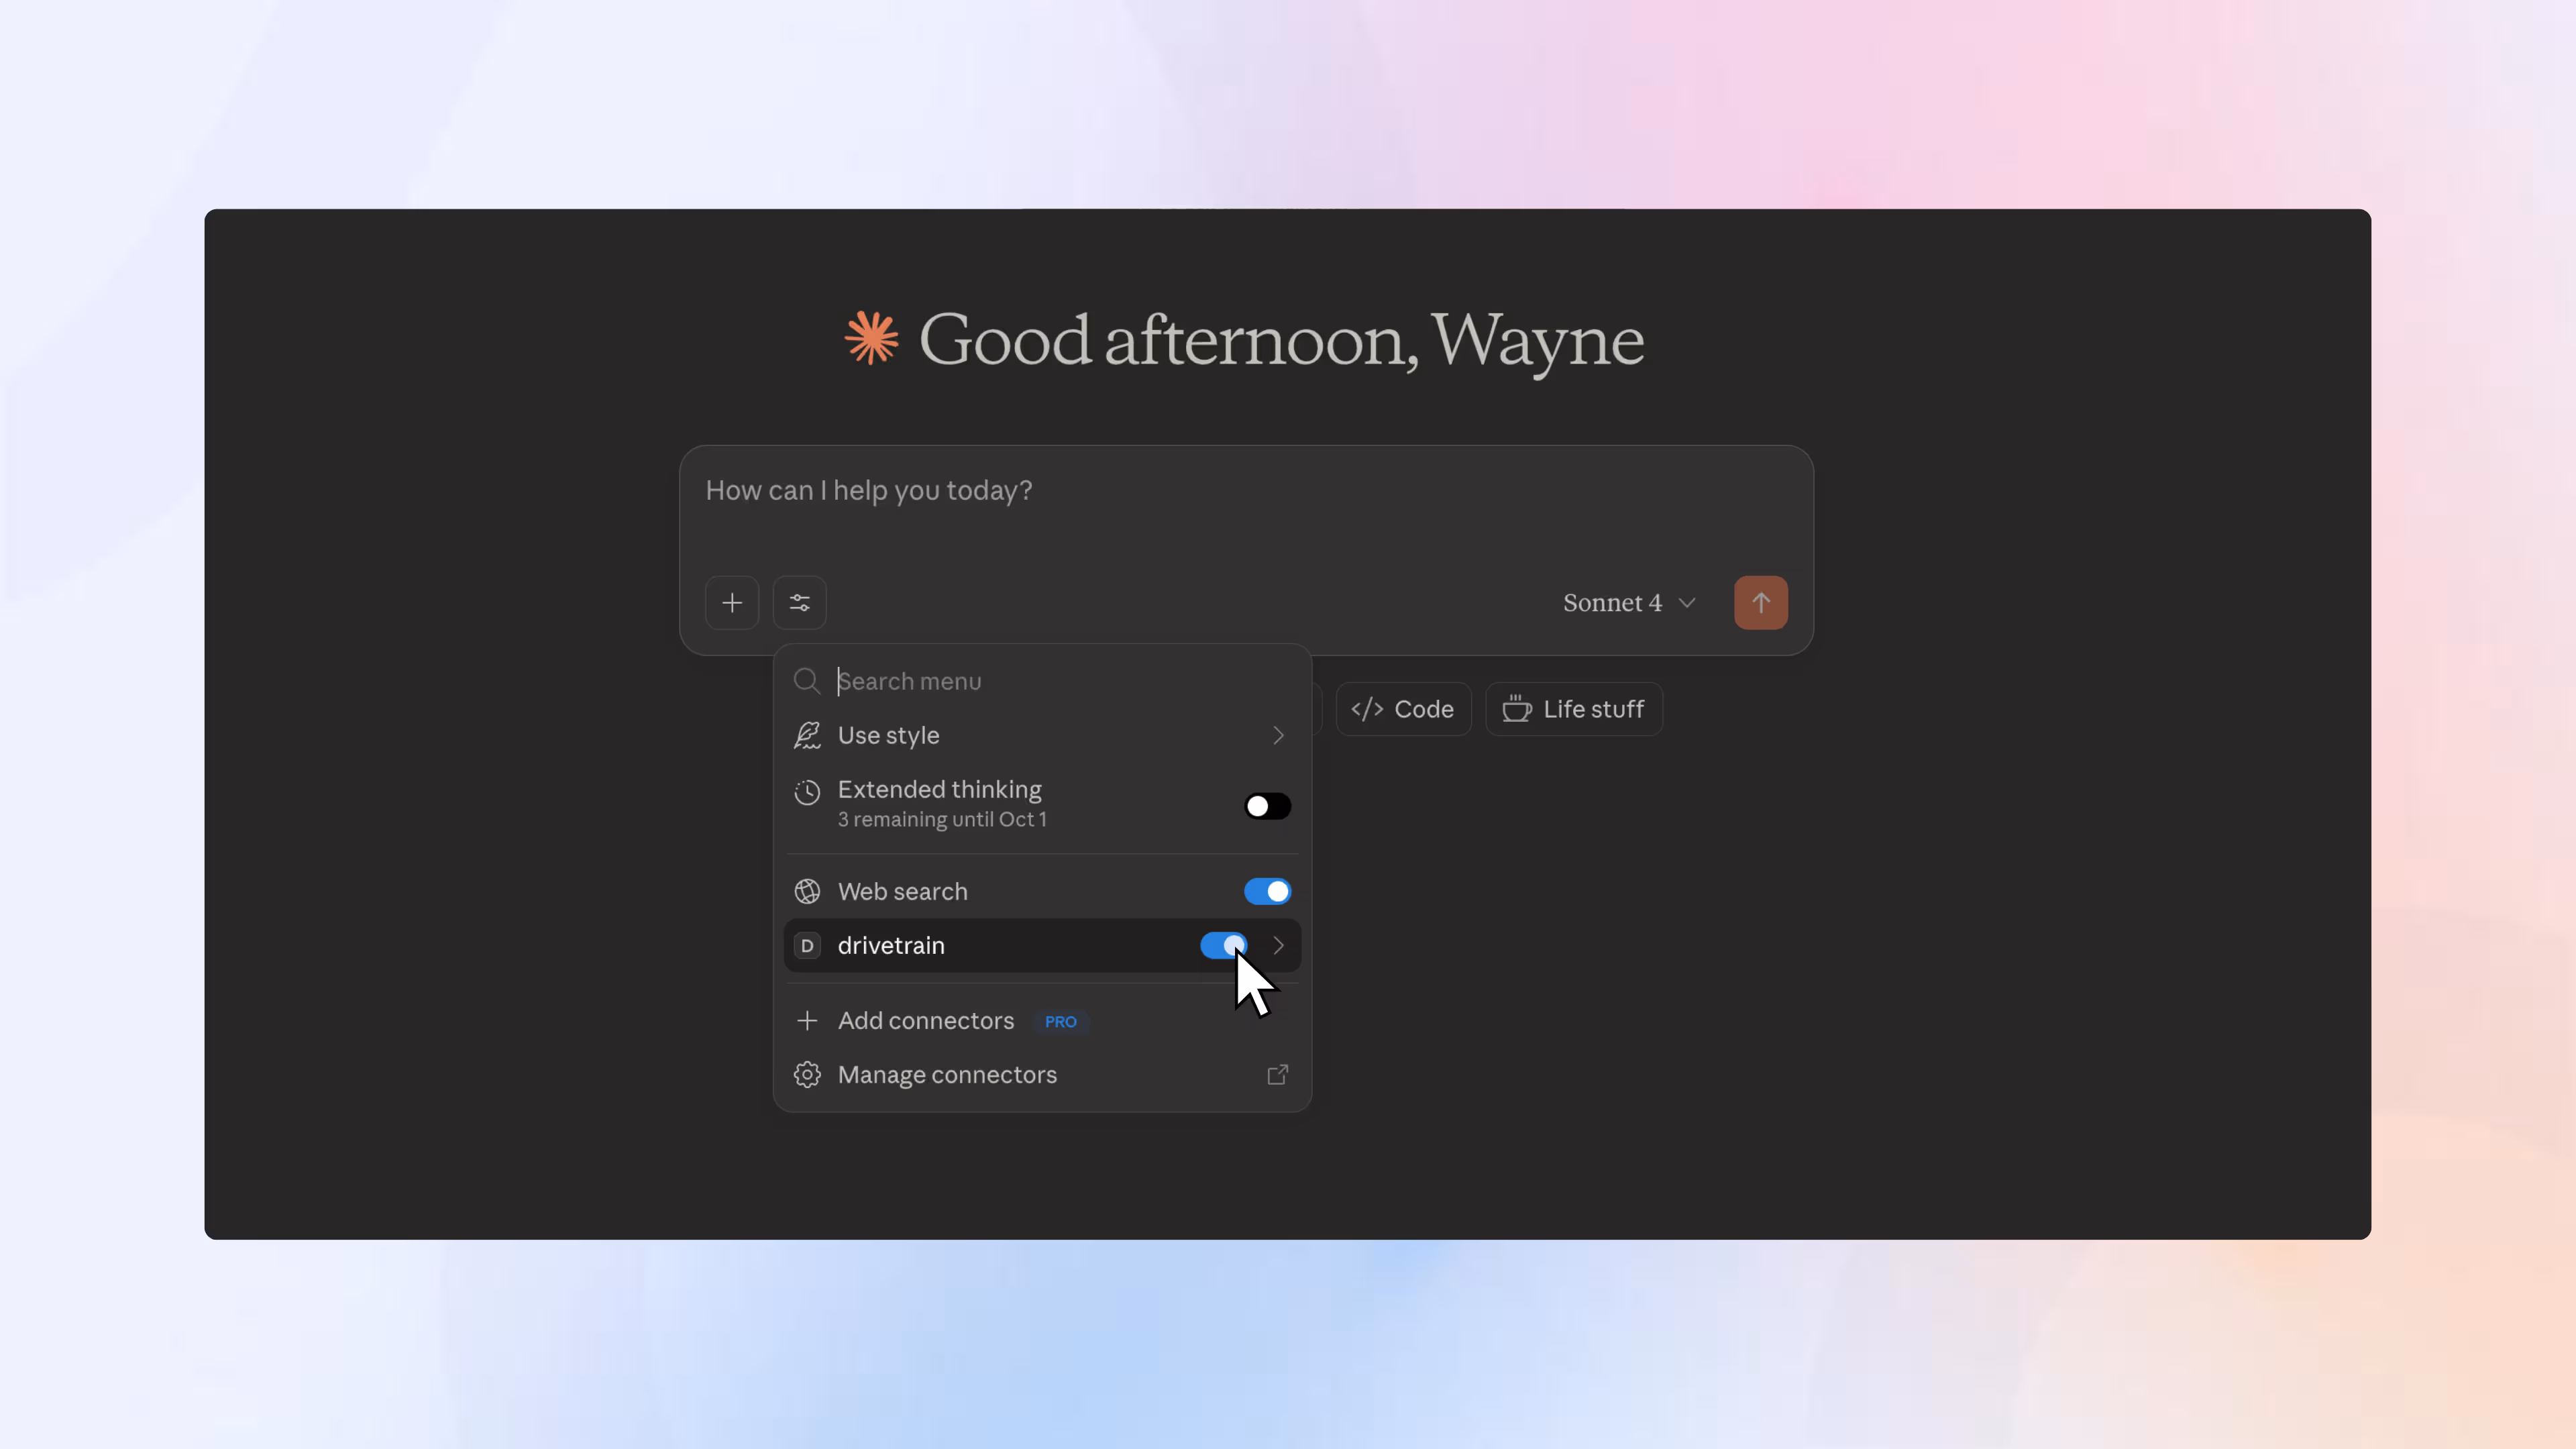
Democratize your data so decisions
get made faster.
Anyone can build and analyze a report with AI without going to finance. Role-based access controls mean everyone sees only what they should.
Through Drivetrain's MCP server, your team gets answers to their questions inside the tools they already use, like Claude and ChatGPT, with their permissions following them.
.webp)

“Drivetrain automated a majority of our financial reporting, from board decks and monthly closes to flux analyses and BvAs out to budget owners. It saved us significant time just a few months after we began implementation.”

“We have a lot of systems integrated: QB, Zoho, Databricks, SFDC & Bamboo. Accessing and analyzing data is now seamless; everything is centralized and easy to retrieve, which has greatly improved our decision-making process.”

“Before, every request from investors meant downloading multiple CSVs, consolidating, and slicing data by hand, which took hours. Drivetrain gives me every KPI across all my QuickBooks instances in one place, so I get insights in seconds, not hours.”
.svg)
“The platform integrates well with other systems, which helps keep data flowing cleanly. Having actuals, forecasts, and scenarios connected in one environment improves confidence in the numbers and supports better alignment across the business.”
See how financial reporting works on Drivetrain
Reporting agent: Generate live dashboards using plain English
Insight Agent: Ad-hoc FP&A answers, grounded in your data
Data Transformation: Transform your data with no code

Board reporting: Sync board decks with real-time data
MCP server: Turn AI into a finance co-pilot

Drivetrain Slackbot: Just ask Drivetrain
Sharing reports: Share insights your way
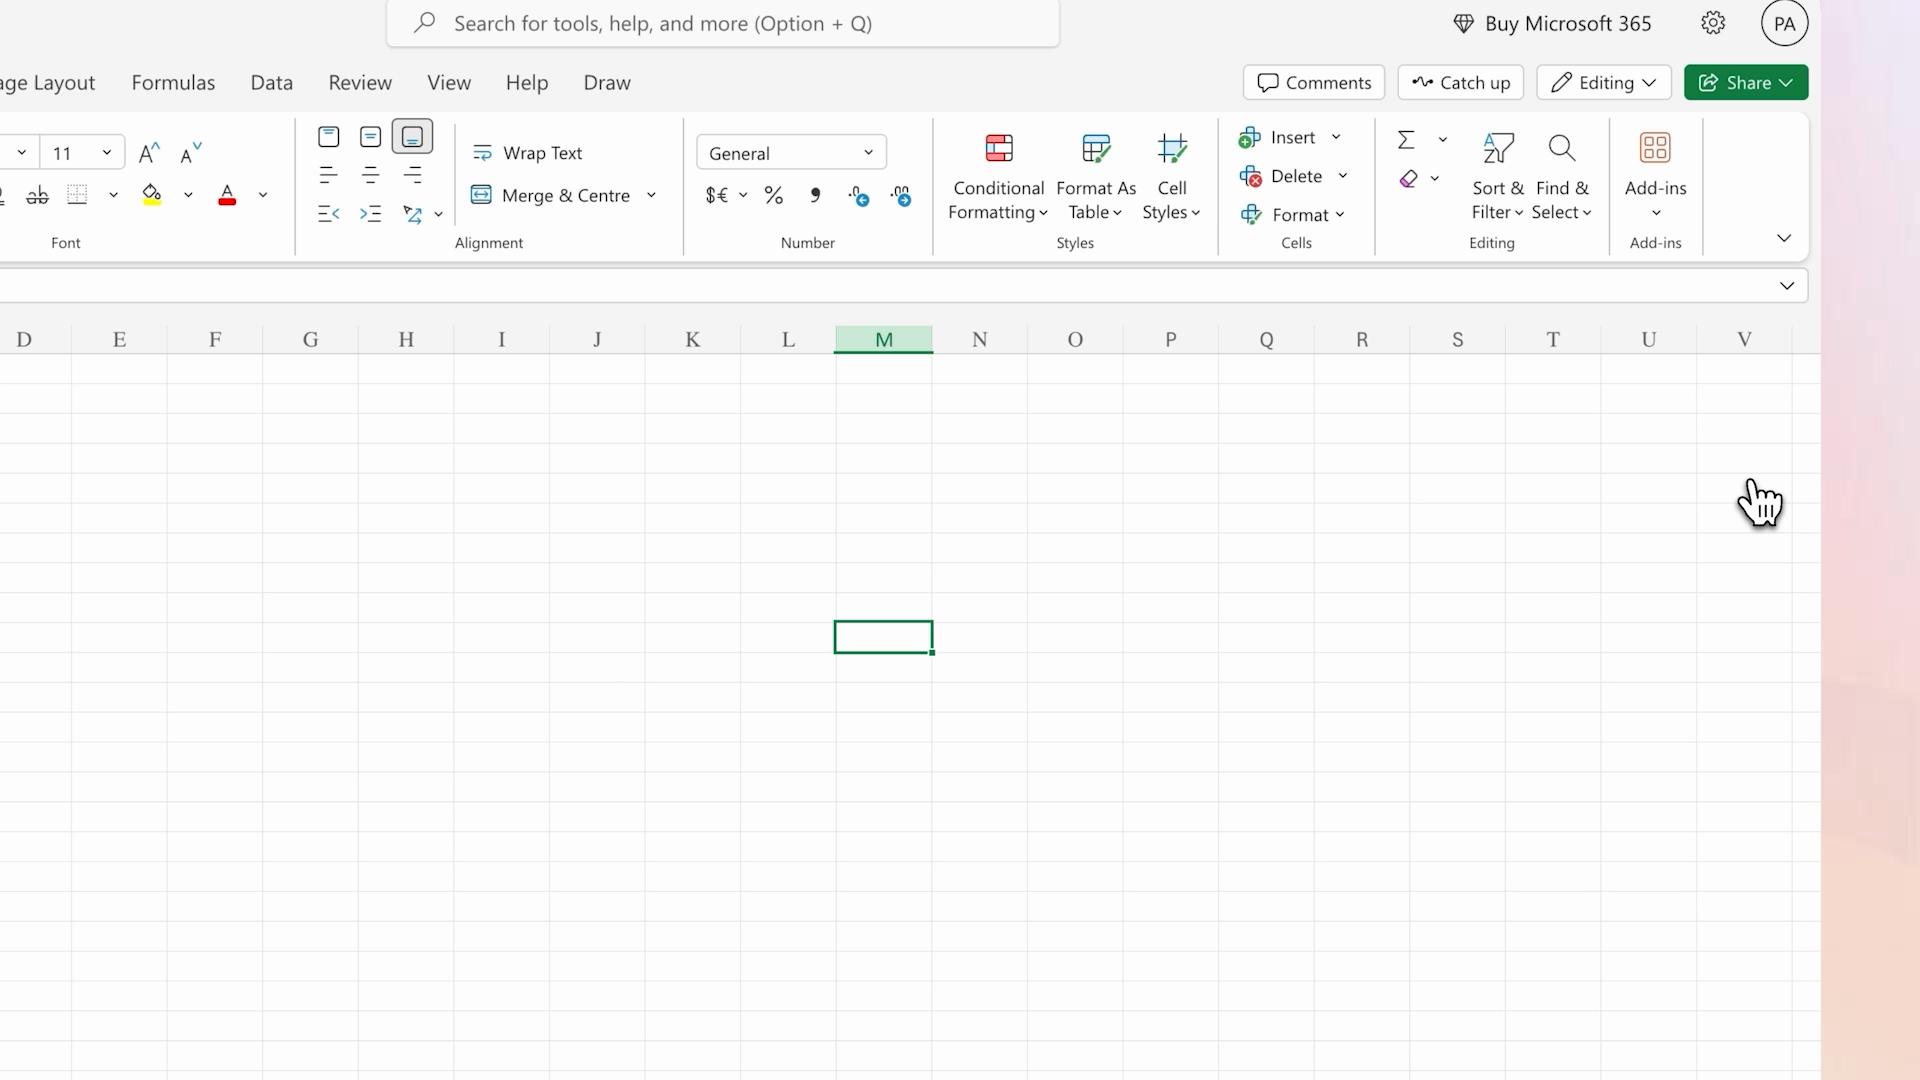
Excel Add-in: Bring live Drivetrain report tables into Excel
Modern finance teams use Drivetrain to do more
.png)
.png)
.png)
Can you connect to our ERP and auto-create our financial statements?
Yes. Drivetrain connects to 30+ accounting and ERP systems, including NetSuite, QuickBooks, Sage Intacct, Xero, and Rillet (see the full list here). It comes with out-of-the-box templates for the models and reports every finance team needs, like the 3-statement model, built on industry best practices. Connect your ERP, and Drivetrain’s AI reads the dimensions in your data and builds these models and the corresponding reports. Once built, your data refreshes on the cadence you set, daily, weekly, or on demand, so your statements stay current and don’t need rebuilding.
Can you build the reports in our company's format?
You can build reports in the exact format your board and investors expect, then save them as templates that refresh daily, weekly, or on demand.
Can I go back and see exactly what we reported to the board last quarter?
Yes. When you lock a version, Drivetrain saves a snapshot of all the underlying data. You can pull up any past number you reported to the board whenever you need it, and also see the calculations behind it.
Will the AI show me what's driving a variance? Can I drill down to find out why?
Ask AI to run the budget vs. actuals, and it identifies the drivers behind each variance and drafts the commentary. You can also drill down by any dimension, like product line or region, and go down to the transaction level to find the root cause.
How many levels deep can I drill? Can I keep peeling back like I would in Power BI or Looker?
You can drill down from any number all the way to the underlying transactions, and slice your data by any dimension.
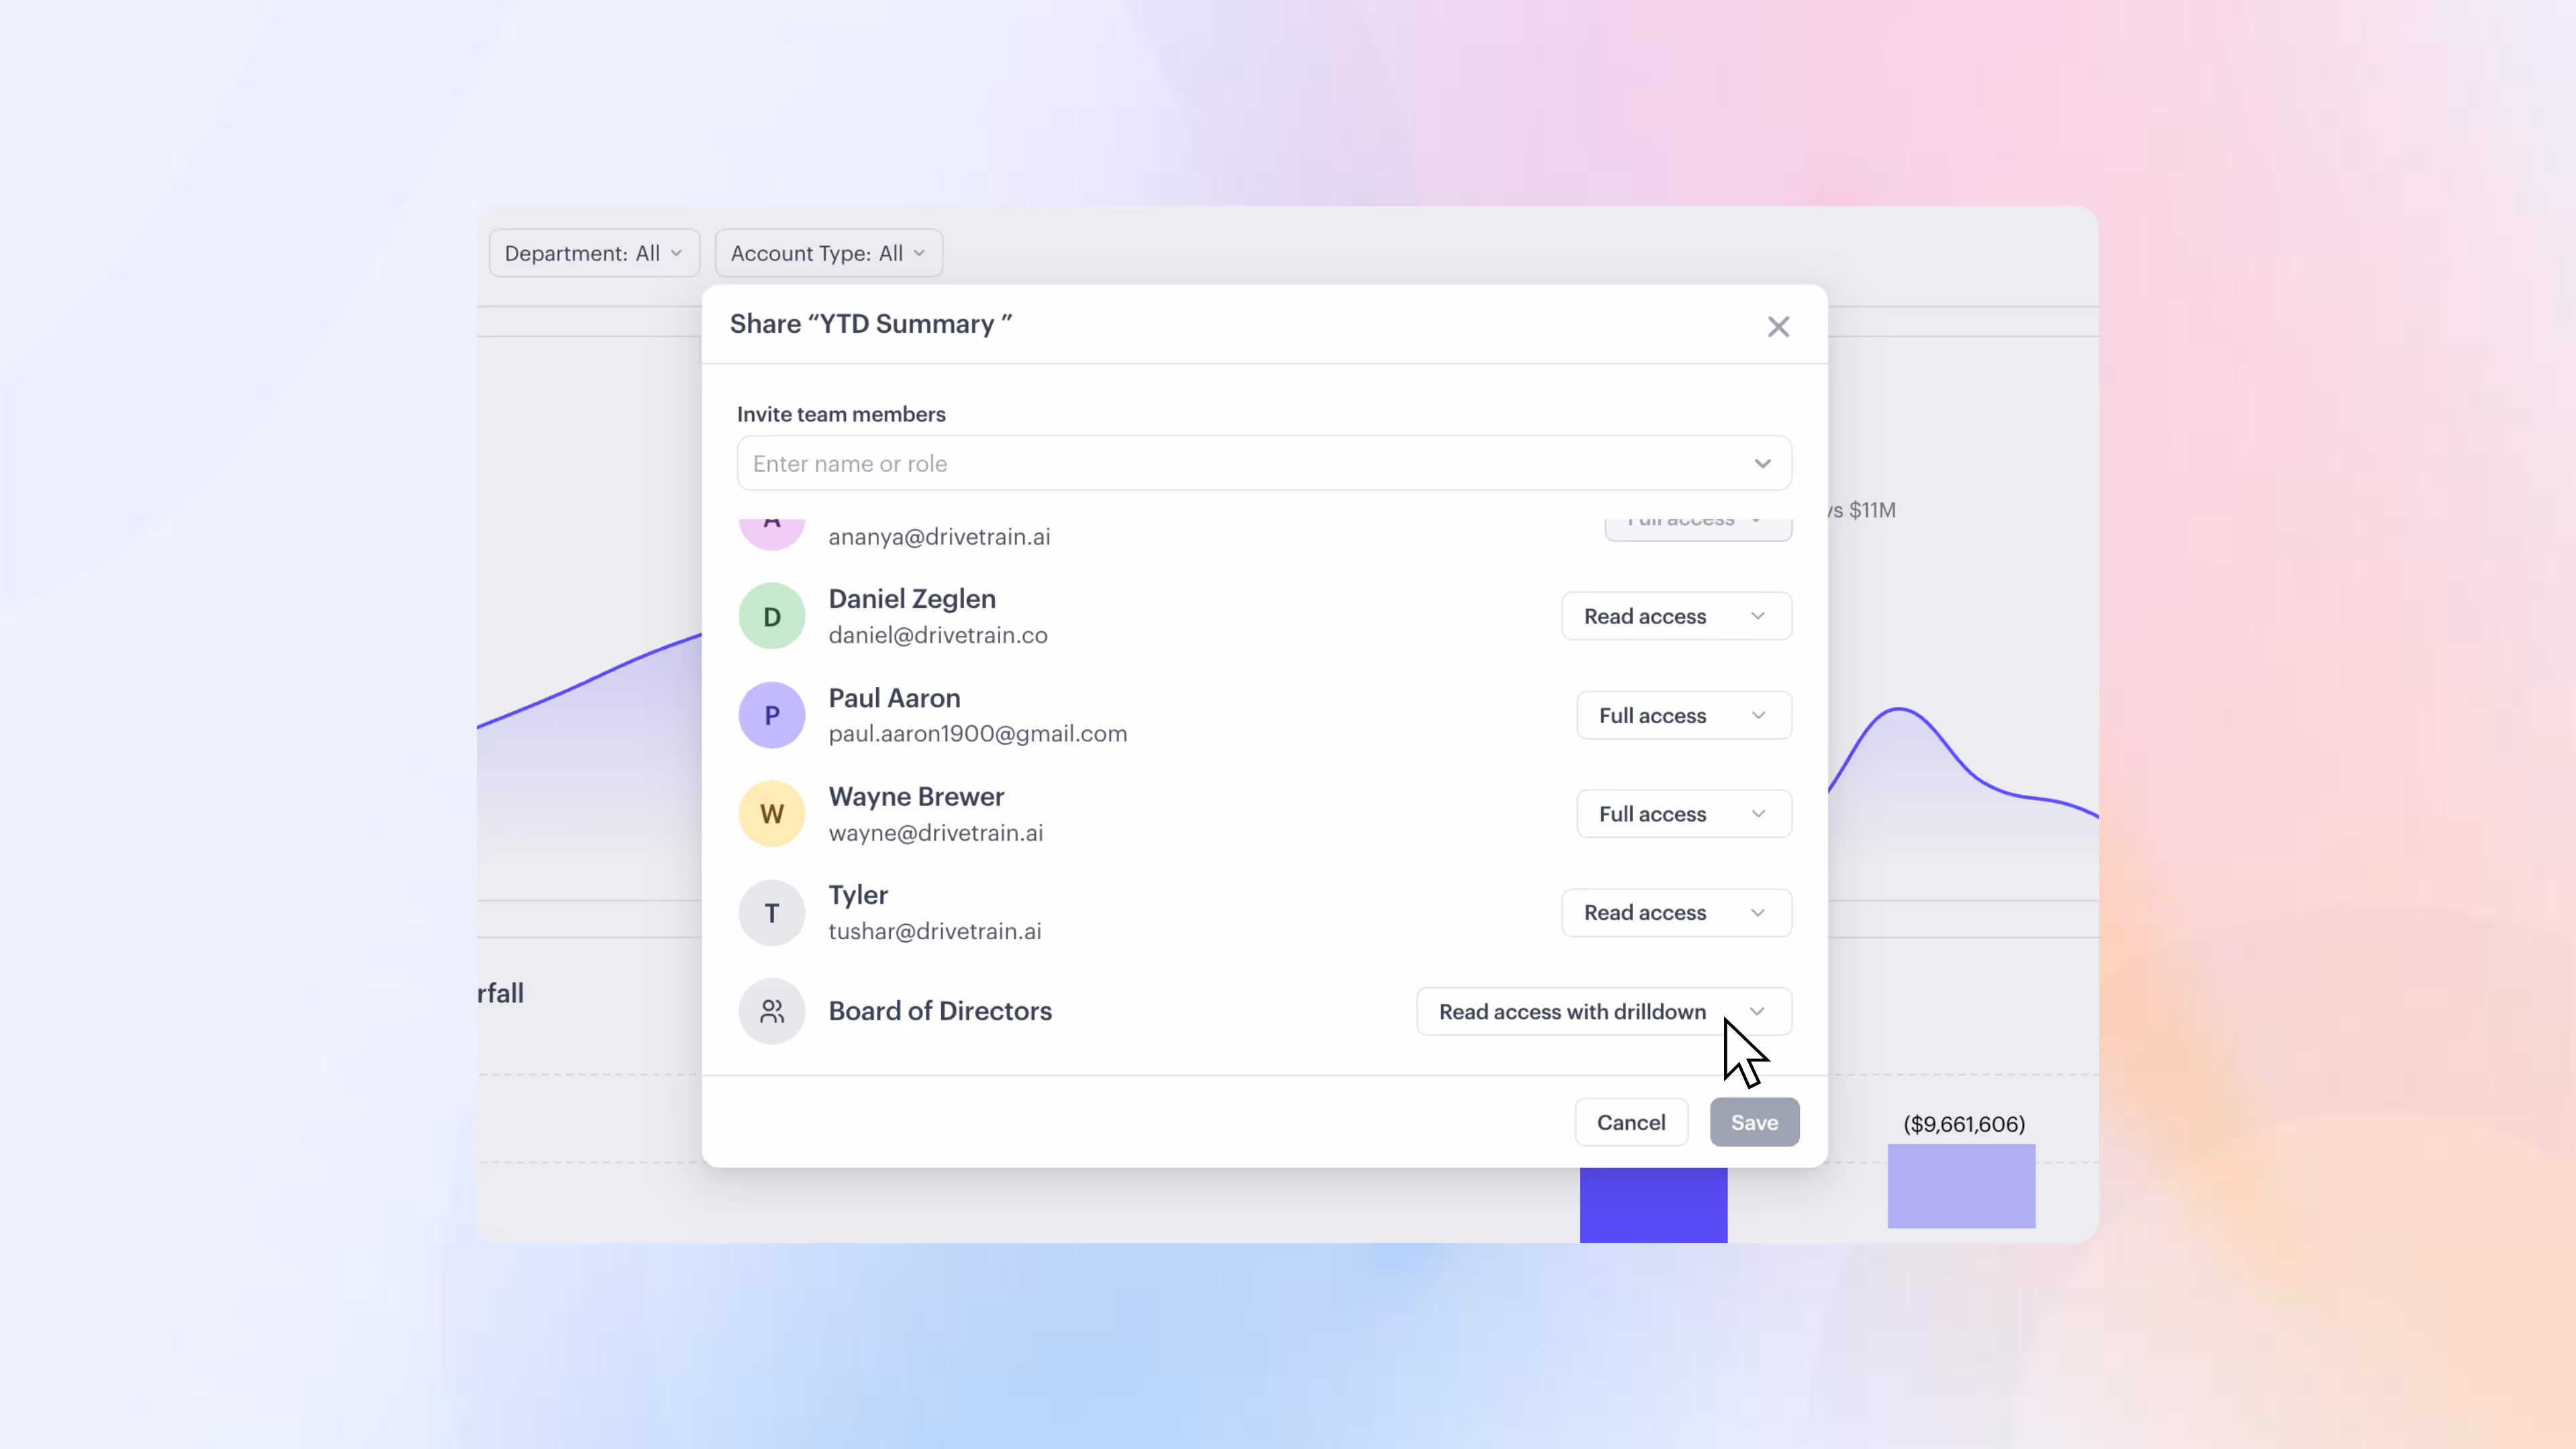
Can I control who sees what — for example, hide salaries from some viewers?
You set access for every user or user group, and define it for each report, model, scenario, metric, and dimension. For sensitive numbers like salaries, you can mask the detail so modelers see the totals they need to plan and forecast, while employee-level compensation stays hidden.
Can I link it live to our Excel and Slides board deck?
You can sync Drivetrain charts live into Google Sheets and Slides, or use our Excel plugin for a two-way sync between your spreadsheets and Drivetrain.
Can I give the board and investors view-only access?
Yes, you can share any report or dashboard with view-only access, so they always see the latest numbers but can't change anything.
How accurate is the AI?
Every number in Drivetrain is produced by a deterministic calculation engine, not generated by AI, eliminating the risk of hallucination. And every number can be traced back to its source so you can verify it yourself.
Still preparing your financial
reports manually?
See how Drivetrain turns your source data into board-ready
reports automatically.