Read TL;DR
- Sales and marketing as a percentage of revenue (S&M%) is a SaaS metric that shows how much of your revenue is being reinvested in growth.
- It’s generally interpreted with other supporting KPIs, such as CAC, CAC payback period, and sales efficiency metrics, to make decisions.
- Tracking S&M metrics reliably is easier with comprehensive financial planning and analysis (FP&A) software, which integrates with different types of financial management tools to automate data aggregation and calculation of S&M%, along with other key unit economics.
Growth doesn’t come easy for SaaS companies. Sales and marketing (S&M) are often their biggest bets for acquiring, converting, and retaining customers. SaaS companies track S&M expenses because they are the fuel that powers revenue growth.
Summary
Sales and marketing as a percentage of revenue (S&M%), sometimes referred to as the S&M ratio, is an efficiency metric that indicates how much your company spends to acquire and retain clients. SaaS companies use S&M% to gauge the effectiveness of their sales and marketing strategies and associated spending in driving growth.
Sales and marketing as a S&M% shows how much of your income is reinvested into growth.
In this guide, we walk you through the basics of S&M%, how to calculate it, and the best way to track it in real time.
What is the role of sales and marketing in SaaS?
Sales and marketing (S&M) expenses include money spent on activities that help grow your business.
It’s one of the four fundamental expense categories for a SaaS company. The other three are cost of goods sold (COGS), research and development (R&D), and general and administrative (G&A) expenses.
S&M is a major expense category for SaaS companies because you sell a subscription, not a product. Subscriptions take time to pay off. That puts customer acquisition at the front, which is why S&M is a major line item on a SaaS company’s income statement.
S&M also has other roles to play. For example, it’s your primary tool to accelerate revenue and educate your customers.
It also has a strategic role. Since you’re spending plenty of money on acquiring customers, your customers’ lifetime value (LTV) must justify that customer acquisition cost (CAC). Without tracking your S&M expenses, you’re just throwing money around hoping everything will work out.
What are the common S&M expenses in SaaS?
The income statement typically shows S&M expenses clubbed into various categories, such as digital marketing or personnel costs. Let’s look at some examples of costs that may be included in these categories:
Tools and technology
This includes the cost of systems you use for sales and marketing, such as:
- Sales management software (CRM software, lead enrichment tools, eSignature software)
- Marketing management software (marketing automation platforms, SEO and content tools, analytics tools)
- Data and intelligence software (customer data platforms, ABM platforms)
Personnel costs
Personnel costs are money you pay to people on your team to sell and market your product.
This includes sales team salaries, commissions, benefits, payroll taxes, contract labor, traveling, and training costs.
Content, brand marketing, and PR
Disseminating information and awareness about your product through digital and print media costs money.
You’ll need to budget for production and publishing both—the costs add up quickly but results may come gradually.
Digital marketing expenses:
PPC, SEO, and other advertising media cost money. However, they typically produce faster results than organic channels.
Website-related expenses
Building and regularly updating your website costs money. These may include domain and hosting fees and a one-time website creation fee.
Customer success
Not all customer success costs are added to S&M expenses on the income statement.
Costs associated with driving expansion revenue, such as upselling, cross-selling, or increasing seat count, are categorized under S&M expenses. Whereas, the costs of supporting, retaining, or renewing existing customers are typically categorized as cost of revenue (or cost of sales).
Events and conferences
If you’ve sponsored a conference or set up a stall at an industry event, that’s an S&M expense.
The costs here may include the cost of sponsorship and money spent on moving banners, prototypes, or employees for a demo to the event or conference site, among other things.
Partner and channel marketing expenses
These include the costs of enabling and co-marketing with resellers, affiliates, and other go-to-market partners.
Why S&M expenses are important for SaaS companies
S&M spend unlocks growth for SaaS companies. It’s necessary from day one for customer acquisition, driving adoption, and sustaining retention. S&M expenses impact every stage of your growth journey, whether chasing product-market fit or scaling toward IPO, because S&M expenses are not discretionary for SaaS companies.
S&M is a direct lever on your unit economics. It shapes your CAC, influences your LTV/CAC ratio, and determines how fast your growth can compound. This means investors and boards are closely monitoring these metrics—they reveal your business's health and scalability to them.
S&M expenses are also critical because they’re the biggest expense category for many companies, especially during high-growth phases. But spending money is only half the story. What matters more is how efficiently your S&M activities convert into pipeline, bookings, and expansion.
As your company matures, your S&M strategy will need to evolve. You might need support from enterprise sales teams, invest in new channels, or adjust pricing strategies to maintain growth. Tracking your S&M cost structure is critical because, as it evolves to accommodate new strategies, you’ll need to make strategic decisions like reallocating budgets and investing in new, more powerful tools.
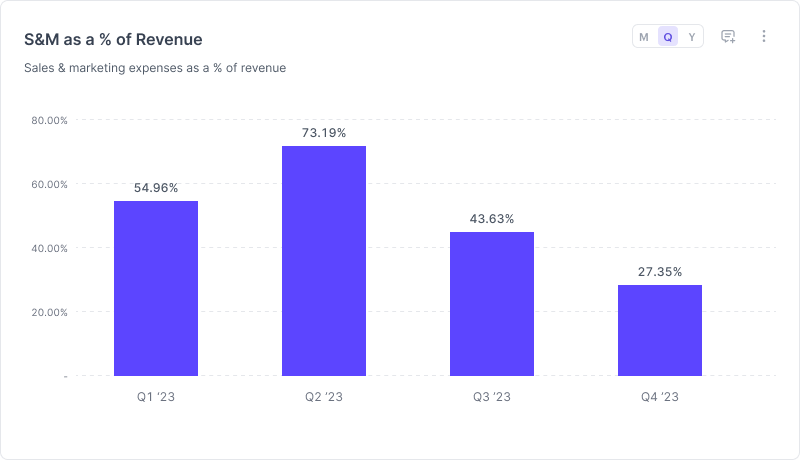
How is S&M as a percentage of revenue calculated?
Here’s how you calculate S&M as a percentage of revenue:

This ratio tells how much of your revenue you’re reinvesting to acquire, convert, and retain customers.
Suppose you’re an early-stage SaaS company. You bring in $4.5 million in ARR and spend $1.25 million on S&M. That’s a 28% S&M%—a fairly lean figure for a company still in growth mode:

Early-stage companies may have higher ratios (sometimes more than 60%) as they prioritize market share over margins. However, as revenue scales and customer acquisitions become more efficient, that percentage typically trends downward.
S&M as a percentage of revenue gives you a big-picture view and should always be interpreted in the context of:
- Customer acquisition cost (CAC): CAC tells you how much it costs to acquire each new customer. CAC is calculated as:

- CAC Ratio: The CAC ratio measures the cost of generating $1 in ARR. For example, if you spend $100 to acquire a customer and they spend $500 during their first year as your customer, your CAC ratio is 5 ($500/$100).
SaaS companies often split this metric further into new CAC ratio, which excludes money spent on expansion. Suppose you're halfway through the year, and your first customer signed up for an add-on and paid $600. Your CAC ratio in that case is 6 ($600/$100), but new CAC ratio is 5 because it excludes expansion revenue.
- LTV:CAC Ratio: A high CAC might be justifiable if you’re closing large enterprise deals with strong LTV. But you lose value if you’re spending $3,000 to acquire a customer who only brings in $2,000 in LTV. To calculate LTV:CAC, just divide LTV by CAC:

You can also think of LTV:CAC in the context of S&M as a percentage of revenue. Suppose you have one customer. You spent $100 in S&M to acquire the customer, and they have generated $500 in revenue so far. S&M as a percentage of revenue is 20%. The inverse of this (1/20%, which is 5) is the LTV:CAC ratio you need to break even operationally. This means the LTV of that customer should be at least $500.
- CAC payback period: The CAC payback period measures the time it takes to earn back what you spent to acquire a customer. The shorter this period, the better. Here’s the formula:


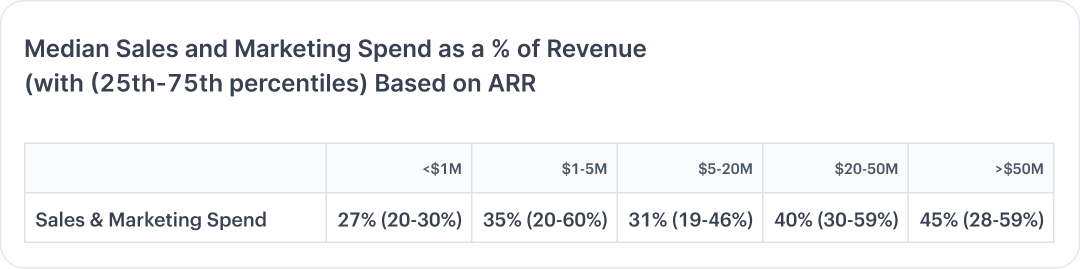
What are the SaaS industry benchmarks for S&M spending?
Your company’s S&M budget should align with your own goals. However, there are a few benchmarks you can look at to see where you stand in the crowd.
Typically, larger companies spend more on S&M—45% is the median for companies with over $50 million in ARR. The lowest for that category is 28%, while the highest is 59%:
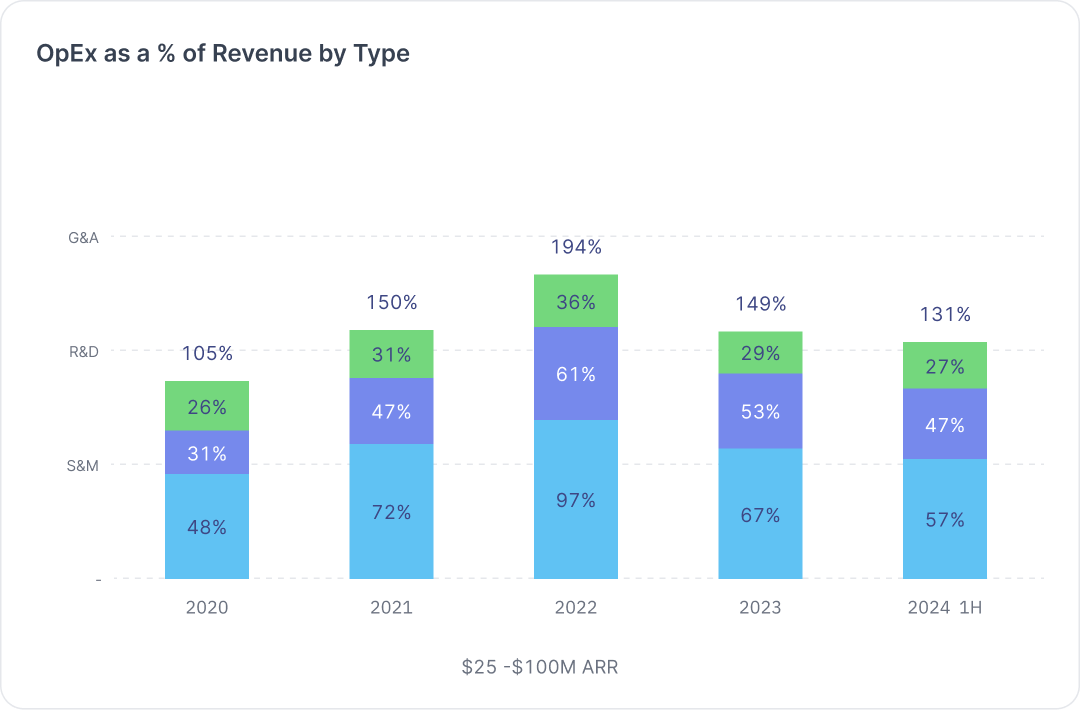
The following three bar graphs show the OpEx expenses for SaaS businesses based on their ARR based on a 2024 study by ICONIQ. The S&M expenses are shown at the bottom of each graph.
Notice the change in S&M spends between 2020 and 2022. For all but the largest businesses, S&M spend almost doubled, which suggests that S&M spending for smaller businesses tends to be cyclical.
This intuitively makes sense. When the economy is on your side, doubling down can help quickly boost revenue.


Higher S&M spending typically accelerates growth. For example, one study found that growth rates improve when S&M spend as a percentage of revenue exceeds 30%, but the results are mixed when that figure is under 30%:

A major reason for this is that there’s more competition among companies able to spend under 30% of their revenue on S&M.
This means companies spending more than 30% can typically gain more visibility in the market and reach more customers.
How to track and monitor S&M expenses
There are various ways to look at your S&M expenses instead of just the total. Here are some ways to gain strategic insights into S&M:
- Real-time spend visibility: Implement an automated expense tracking tool to monitor spend as it happens instead of just looking at the total expense at month-end. This allows you to catch overruns early, identify underperforming initiatives, and reallocate budget as needed.
- CAC breakdown by channel and segment: Analyze CAC by channel (paid search, field sales, content), customer segment, and geography. This helps identify strategies that deliver the best ROI and ones that drain your budget.
- Segment and cohort analysis: Track cohorts based on when and how customers are acquired. This shows how different campaigns and strategies affect long-term retention, expansion, and LTV across customer types.
- ROI and attribution tracking: Tie each dollar to specific business outcomes by tracking KPIs like pipeline generated, deals closed, and revenue influenced. Use attribution models (preferably multi-touch) to understand how different campaigns and touchpoints contribute to customer acquisition and revenue. This ensures you invest more in what actually works and cut spending on ineffective strategies.
- CAC payback monitoring: Keep an eye on how long it takes to recover CAC through gross margin contribution. If your CAC payback period is in an uptrend, look for inefficiencies before they accelerate cash burn.
- Budget forecasting and flexibility: Build detailed S&M budgets that reflect your growth targets. Account for seasonality and planned campaigns. Most importantly, bake in a buffer for experimentation—this is where you can build a competitive advantage.
- Sales efficiency metrics: Track important revenue efficiency metrics like Q factor, average sales productivity, average sales cost efficiency, win rates, and sales cycle length. Insights from these metrics can help fine-tune your sales process and identify where additional training or headcount may be needed.
- Competitive benchmarking: Regularly compare S&M expenses, CAC, and payback period against industry benchmarks and peer companies. This helps validate your S&M strategy and identify red flags before they impact performance.
- Customer segment performance: Monitor how S&M spend and outcomes vary by customer segment, industry, or company size. This allows you to double down on high-yield segments and optimize messaging, positioning, and spend accordingly.

Making data-driven decisions about your S&M strategy doesn't have to be difficult
S&M as a percentage of revenue is a reflection of your growth strategy and the effectiveness with which you acquire and retain customers. But it’s a data-driven endeavor. You need real-time data to track real-time S&M expenses, CAC, cohort performance, and other KPIs.
Modern financial planning and analysis (FP&A) software can significantly streamline this work by automating data aggregation and metrics calculation. However, not all FP&A tools are created equal. Many have different limitations, especially in terms of the number of systems they can integrate with and the types of metrics you can track with them.
Drivetrain has no such limitations. It is a comprehensive and robust FP&A platform that, with more than 800 integrations can connect to all your financial management tools. And with the ability to easily create custom metrics, you can dive deep into your data to quickly generate data-driven insights to inform our S&M strategy in real time.
Explore Drivetrain to see how it empowers both finance teams and GTM leaders, giving them the visibility they need to make faster, smarter decisions.

FAQs
The answer depends on your goals. Companies typically end up with a 40:60 or 60:40 split, depending on the GTM motion. Product-led or inbound-driven models tend to be more marketing-heavy, while enterprise sales motions tend to favor higher sales spending.
In SaaS, S&M expenses are typically positively correlated with growth, meaning higher S&M spending accelerates growth. However, this is not always the case. For example, a 2024 study by Key Bank found that growth rates improve when S&M spend as a percentage of revenue exceeds 30%, but the results are mixed when that figure is under 30%.
It depends on your company's size (by revenue), growth stage, and business model. High-growth and small companies need to spend more on S&M to sustain growth. However, a large-sized company may spend more than a small company if it sees growth potential or wants to expand into new markets.
SaaS industry benchmarks can help you determine what might be reasonable for your business.
For companies with:
- Less than $1M in ARR, the range was 20-30% with a median of 27%
- $1-5M in ARR, the range was 20-60% with a median of 35%
- $5-20M in ARR, the range was 19-46% with a median of 31%
- $20-50M in ARR, the range was 30-59% with a median of 40%
- More than $50M in ARR, the range was 20-59% with a median of 45%
Like this article?
.svg)

.svg)
.svg)
%20Header.svg)


