.svg)
Read TL;DR
- Customer engagement score is a metric that quantifies how actively users interact with your product.
- CES provides early indicators of customer retention and churn. High CES suggests customers are realizing product value and are more likely to renew or upgrade. A declining CES alerts customer success teams to intervene before it’s too late.
- It is calculated using weighted customer behaviors like logins, feature usage, and referrals.
- To calculate CES, identify high-impact user behaviors, assign weighted values to each, and compute a composite score. Weighting allows you to prioritize high-value activities over superficial engagement.
- Measuring CES helps optimize product decisions, improve onboarding flows, and align customer success strategies with real user behavior. It’s especially useful in SaaS, where digital engagement predicts long-term value.
- Segmentation by CES tiers (high, moderate, low) lets teams customize outreach and support, from nurturing at-risk users to activating loyal customers for referrals and upsells.
Customer relationships drive business growth. But measuring the health of those relationships has traditionally relied on lagging indicators like churn rate or revenue per customer. By the time these metrics signal trouble, valuable customers may already be lost.
Businesses today need a more proactive approach to understand overall health of their customer base and its potential for growth (or contraction) over time. Tracking customer engagement can help with that.
Summary
Customer engagement score (CES), also known as engagement score, is a single quantitative metric that measures how actively customers interact with a company's products or services based on their usage patterns and behaviors.
CES is a composite score that helps businesses identify at-risk customers before they churn, predict revenue opportunities from existing accounts, and optimize customer success investments for maximum return.
This article will show you how to calculate customer engagement score and use CES data to drive strategic business decisions that improve customer retention and accelerate revenue growth.
What is the customer engagement score?
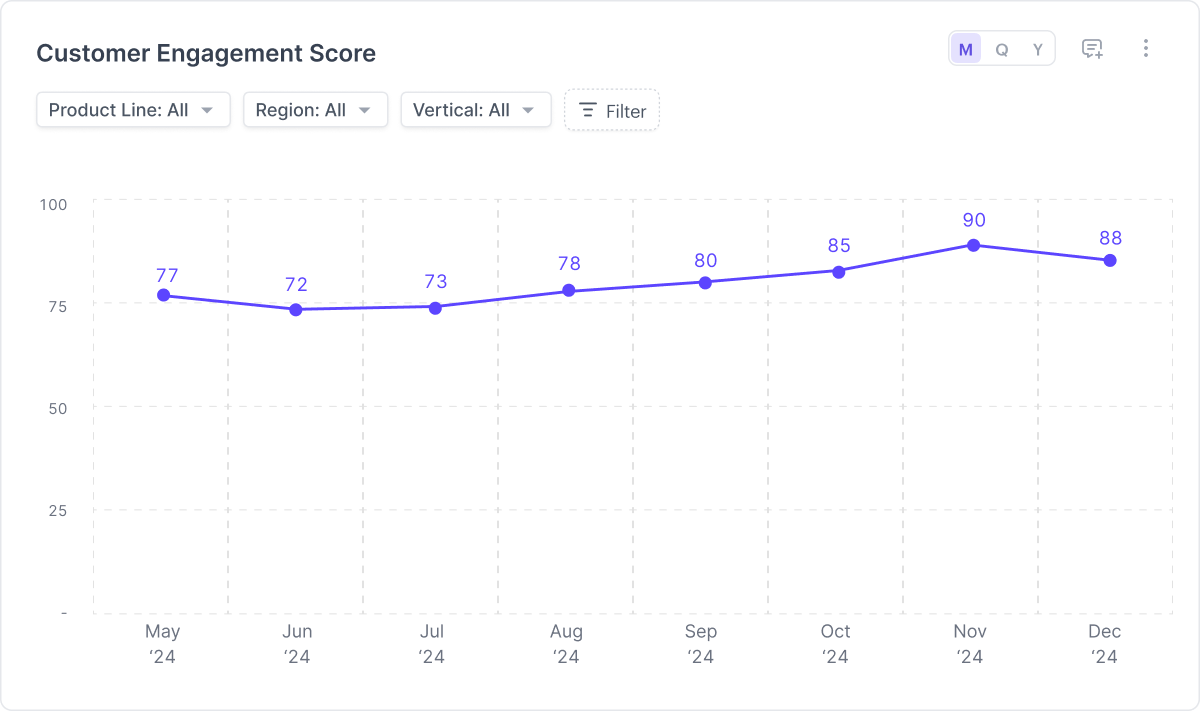
Customer engagement scores can be a vital part of your customer retention strategy.
The customer engagement score is a way of quantifying engagement using various customer activities, such as such as how often customers log in, use key features, interact with content, or contact support, over a given period of time. Each of these "signals" is assigned a point value, which when added together into total score, provides a pretty clear picture of how engaged your customers are.
While this metric was originally developed for SaaS companies, CES is now used by companies in a lot of different industries. Any business with digital customer interactions can implement engagement scoring.
CES is more of a forward-looking metric. A high score means customers are getting value from your product and are more likely to stay, upgrade, or recommend you to others. A low or falling score shows they may be losing interest, which could lead to churn. Tracking CES helps you spot these signs early so you can step in before customers leave.
It’s worth noting that while CES provides valuable behavioral insights, the metric should be combined with satisfaction scores, support metrics, and revenue data for a complete customer health assessment.
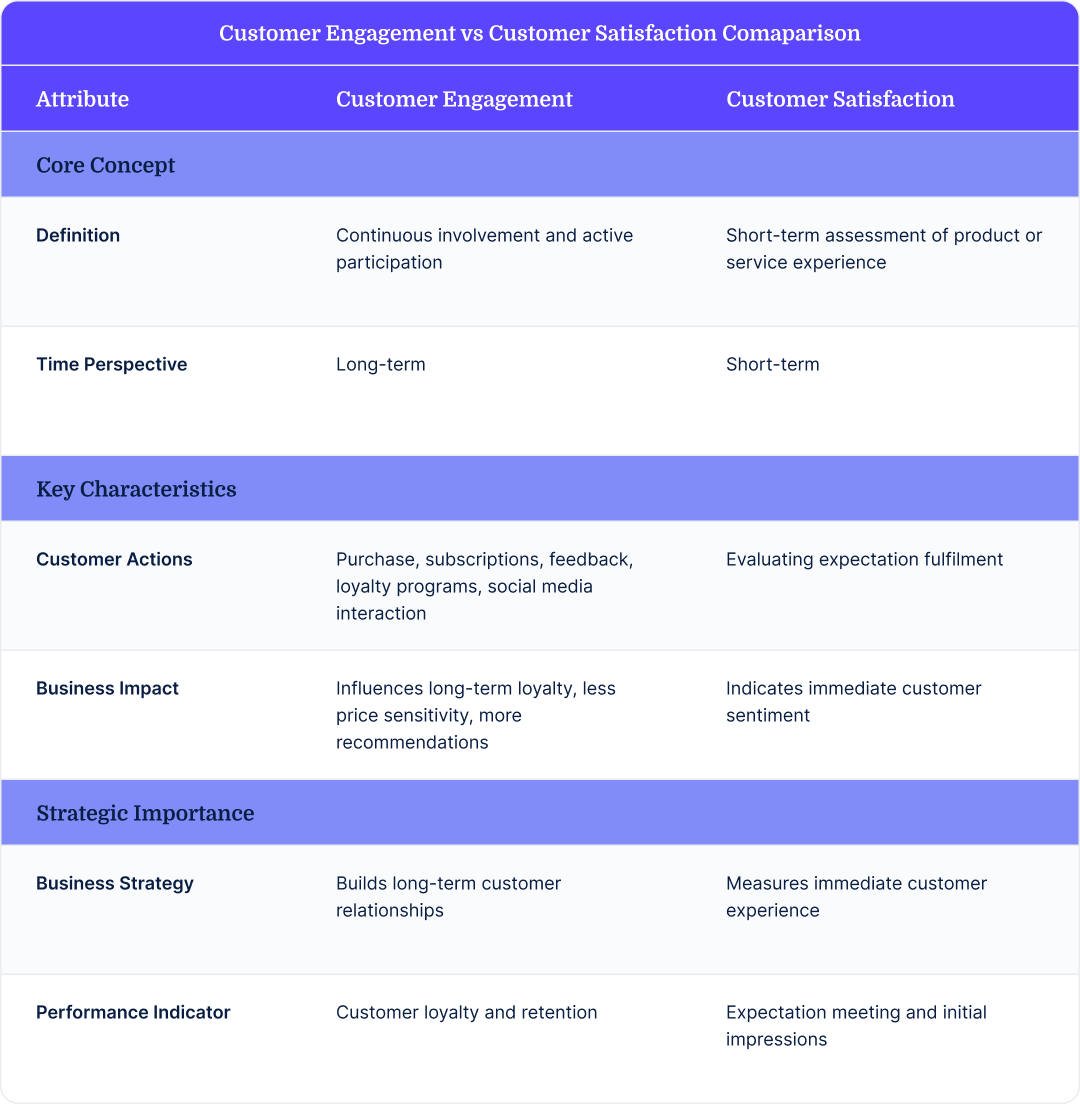
How does customer engagement differ from customer satisfaction?
Customer engagement is a step beyond customer satisfaction. Satisfaction measures a customer’s emotional reaction to a specific experience, while engagement tracks behavioral signals over time.
Here are the notable differences between the two:
How does customer engagement relate to customer retention and churn?
Customer engagement score is a leading indicator of retention and churn. It provides early warning signals that most traditional metrics miss. The relationship between CES, retention, and churn works through predictable behavioral patterns. Your highly engaged customers behave differently from disengaged or less engaged ones.
Highly engaged customers:
- Use the core functionality of your product regularly;
- Integrate your solution deeper into their workflows; and
- Might also explore new features.
In contrast, disengaged customers generally:
- Reduce usage frequency;
- Ditch key features; and
- Decrease interaction before making the decision to cancel.
CES helps you comprehend these behavioral shifts weeks or months before customers actually churn. This predictive capability enables proactive customer success interventions. Teams can identify at-risk accounts and implement targeted retention strategies while customers are still salvageable.
How to calculate customer engagement score?
Calculating customer engagement scores can be complex and time-consuming because “engagement” means different to different businesses. The behaviors that define engagement in an invoicing platform won’t look the same in a CRM or an analytics solution.
It’s also important to note that the specific customer behaviors companies track varies from business to business based on their needs and business models.
Their measurement approaches can vary, too. Unlike customer satisfaction score (CSAT), which typically uses a 0-100 scale, there’s no real standard scale for CES.
Using a scale of 0-100 is pretty common in SaaS, though. So that’s what we’ll use in the following example where we walk you through the calculation of a CES.
Step 1: Identify factors affecting CES
Start with factors like frequency of usage, depth of usage, specific actions taken, clickstream information, and KPIs that correlate with customer value realization. Then, map your customer journey and identify moments where customers derive tangible benefits from your product or service.
Common engagement events include:
- Product usage frequency: Login frequency, session duration, feature adoption rates
- Value-driving actions: Completing onboarding steps, achieving first success milestones, using core features
- Revenue indicators: Subscription upgrades, add-on purchases, renewal behaviors
- Community engagement: Support interactions, feedback submissions, and referral activity
Let’s say a project management SaaS identifies the following events based on their correlation with customer retention and expansion:
- Daily logins
- Project creation
- Report generation
The important part here is to focus on activities that indicate the customer is getting value out of the product—events that predict true customer success. A customer who logs in daily but never completes core workflows may appear engaged but lacks true product value realization.
Step 2: Assign weight to each event
Calculating CES requires you to combine multiple customer behaviors like logins, referrals, or email interactions, into one single score. However, not every behavior is equal. High-value engagement events like add-on purchases, subscription upgrades, and referrals carry more weight than low-value engagement events like basic login activity, account updates, etc.
While assigning weights to each event, use a scoring system where higher weights indicate greater business impact. In addition, implement a time decay system where recent actions carry more weight than historical behavior.
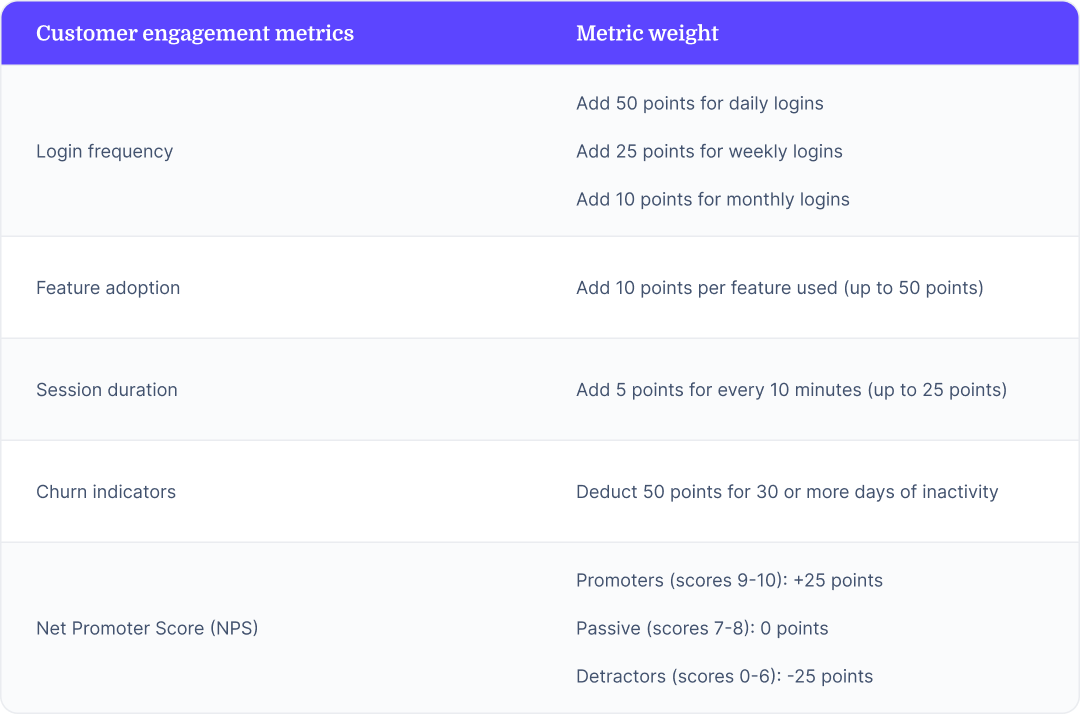
The table below shows customer engagement metrics (i.e., different customer behaviors) that SaaS companies commonly measure to calculate their CES. Note that the metrics here and the weights assigned to them are just examples. The metrics you use and their weighted value will depend on your business and the measurement approach you’ve chosen.
Taking the example of our project management SaaS, assigning weights would work something like this:
- Daily login: 2 points
- Created a project: 15 points
- Report generation: 15 points
Step 3: Apply the customer engagement score formula
Use the formula below to create a single numerical representation of customer engagement.
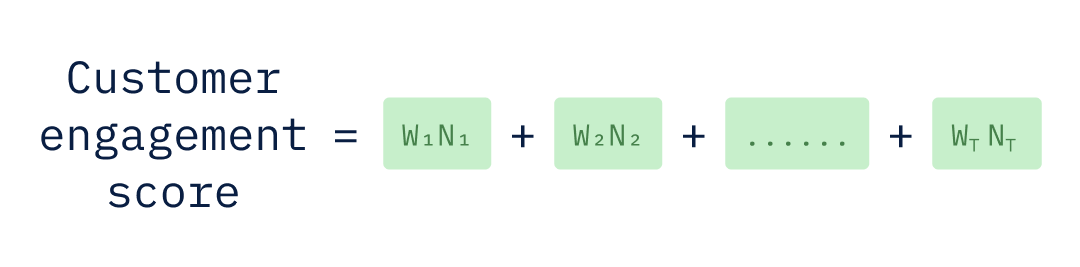
In the formula,
- Wₜ = the weight assigned to event type t
- Nₜ = the number of occurrences of event type t within the measurement period
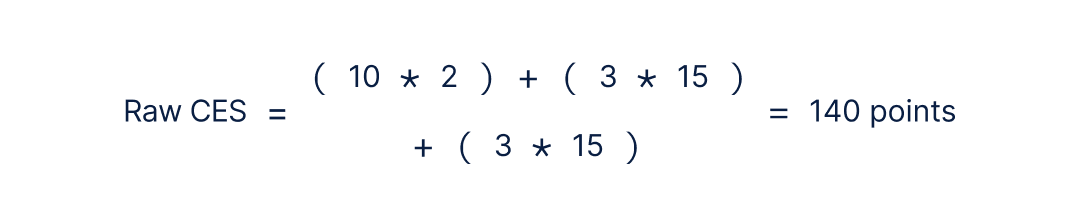
In our customer engagement score example, let’s say a customer:
- Logs in 10 times
- Creates 3 projects
- Generates 5 reports
Our "raw" customer engagement score (i.e. without any normalization) would be 140 points:
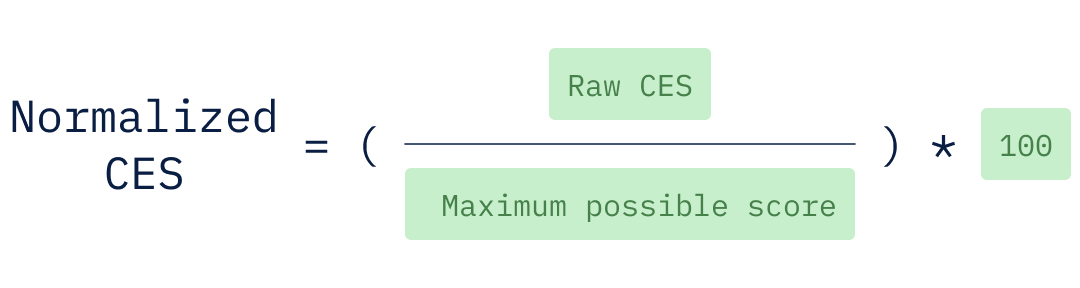
Step 4: Normalize the CES calculation
You may want to normalize the CES to a 1-100 scale. Normalizing is a common practice that makes it easier to benchmark your CES and provides consistency. Here’s the formula to use if you want to normalize your scores:
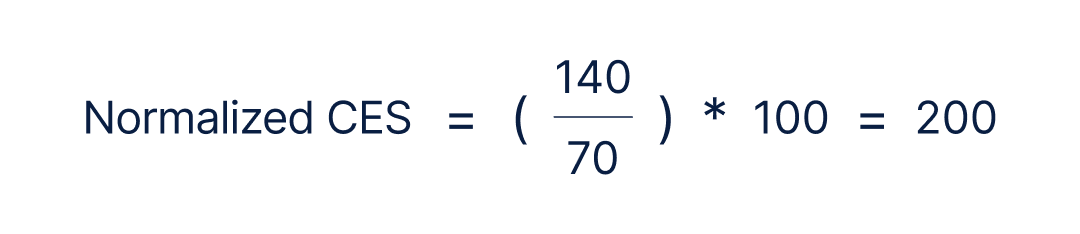
In our example, the customer scored 140 points (raw CES) and the maximum possible score is 200, which gives us a CES of 70.
It’s important to note that CES only provides one dimension of customer health. You should combine engagement scores with satisfaction metrics, revenue data, and qualitative feedback to build a comprehensive understanding of customer relationships.


Why should you measure customer engagement score?
Tracking customer engagement score periodically is essential because it allows you to:
- Evaluate PMF: When your engagement score is consistently high across your user base, it is usually a hallmark of strong PMF. High scores indicate that your product is sticky and customers are finding real value.
- Optimize product functionality: Engagement scoring shows which features drive the most value for customers and which remain underutilized. By analyzing this data, product teams can prioritize development efforts on high-impact areas while identifying opportunities to improve or sunset low-engagement features.
- Mitigate risk of churn: Customer engagement directly correlates with retention, expansion ARR, and long-term profitability. When engagement scores decline, it’s often a sign that the customer is not finding value in your product. Teams can intervene timely and offer additional support or tailored onboarding.
- Support referrals: Highly engaged users are more likely to become your “natural” product advocates. They refer your product to peers without any intervention and spread positive word-of-mouth marketing.
- Align product development: With CES, you get objective feedback on what customers actually value versus what they claim to want. You can then focus on features that drive meaningful engagement rather than superficial requests.
- Guide strategic planning: Engagement score equips finance leaders with crucial insights for strategic revenue planning, budget allocation, and market positioning.
How to use customer engagement scores for segmentation
Monitoring CES across different segments helps you see how each segment is performing compared to others.
For example, you might define three engagement score segments (the exact score ranges can be adjusted for your business needs):
- High engagement (e.g. scores 80–100): These customers are power users who renew at a very high rate. You can afford to spend less hands-on time here, as they’re already finding value and are likely to renew with minimal intervention.
- Moderate engagement (e.g. scores 40–80): These users have decent usage but could be at some risk (say around a 50% renewal rate). It’s wise to proactively reach out to this group.
- Low engagement (e.g. scores 1–40): This segment has a very low level of activity and a high chance of churn. The focus here should be to re-engage these users.
How to increase customer engagement score?
You can use the below strategies to drive higher engagement and long-term customer health.
Optimize your onboarding experience
You can use contextual walkthroughs, interactive guides, checklists, and success milestones to guide new users toward activation. For complex products, you can also do one-on-one onboarding sessions or onboarding webinars with live Q&A.
Identify friction points
Leverage data analytics see where users are dropping off or failing to complete high-value actions. For example, if a large portion of users stop after account setup but never activate a key feature, that signals a UX or messaging issue. Product and CX teams should review these drop-off points regularly and remove friction through redesigns, tooltips, or in-app prompts.
Build guided tutorials and self-serve education flows
Personalized onboarding flows like tooltips, interactive walkthroughs, guided paths, and modular tutorial libraries that adapt based on user behavior helps the user derive value without any additional support.
Create structured feedback loops
To incorporate customer feedback, you can set up surveys at natural milestones, for example, after onboarding completion, first feature use, or 30 days of activity. You can also pair CSAT or net promoter score to get a complete picture of both sentiment and behavior.
Devise targeted campaigns
Another way to increase CES is to use segmentation to launch email campaigns, in-app messages, or ads that are personalized to user behavior. For example, send milestone nudges to new users approaching activation, or re-engagement campaigns to users with declining scores.
Develop proactive engagement strategies
To increase CES, create engagement touchpoints throughout the customer lifecycle, not just during onboarding. Regular webinars, user communities, and educational content help maintain engagement long after initial adoption. Knowing the value of communication with customers would help retain their attention, and you get to know the customer's actual lookout from the product. Leverage the relationship by delivering a personalized experience.
Measure and iterate continuously
Lastly, measure and track your engagement metrics over time to understand what’s working and what needs improvement.
Turn customer engagement data into revenue growth with the right platform
By measuring how customers interact with your product across key touchpoints, CES enables data-driven, strategic decisions that improve customer satisfaction and business outcomes.
However, manually tracking engagement events, calculating scores, and acting on insights is time-consuming and prone to errors. Modern AI-powered FP&A platforms like Drivetrain eliminates this complexity with over 800 integrations that automatically consolidate data from CRMs, billing systems, and other sources into one unified platform.
By connecting with customer engagement and customer success platforms, Drivetrain provides real-time visibility into customer engagement patterns across timelines, channels, and lifecycle stages without manual data compilation. And, it's user-friendly interface with built-in formulas and commands allows you to develop and share specific engagement score reports easily, enabling faster, data-driven decisions about customer health and retention strategies.
Explore Drivetrain to see how it can help you scale your business faster with robust customer engagement tracking and reporting.

FAQs
A good customer engagement score (CES) for SaaS products is generally considered above 70. This reflects the higher end of what is considered moderate engagement based on the following ranges:
- High engagement (scores 80–100)
- Moderate engagement (scores 40–80)
- Low engagement (scores 1–40)
Note that these scoring segments and their associated ranges are examples and vary from business to business. You can adjust them to suit your specific needs.
The frequency of tracking CES depends upon the type of product and its usage patterns. For instance, measuring CES daily or weekly for a project management tool makes sense since users interact with the tool on a daily basis. Similarly, a monthly CES calculation for a billing platform is more appropriate since usage is often tied to billing cycles or financial reviews.
Measuring CES helps you identify any bottlenecks in the customer journey. When addressed proactively, it can prevent customers from becoming frustrated and abandoning your product. Similarly, customer engagement score can help you identify high value customers and you can devise tailored strategies that provide additional value and drive upsells.
The four types of customer engagement are:
- Emotional: The emotional connection a customer builds with your brand.
- Contextual: The engagement that happens in response to a customer’s real-time behavior, situation, or environment.
- Convenient: The engagement driven by ease of access, simplicity, or seamless integration into the user’s workflow.
- Social: The interaction that happens through communities, peer networks, or public channels.
Like this article?
.svg)

.svg)
.svg)

%20in%20SaaS.png)
%20Header.svg)


