.svg)
.svg)


Vena and Datarails are both Excel-native FP&A platforms that promise to modernize financial planning without abandoning the use of spreadsheets. This comparison examines how each handles consolidation, reporting, and scenario planning, then explores the limitations both inherit from their spreadsheet foundations.
You’ll learn about implementation timelines, reporting trade-offs, performance constraints, their AI maturity, and why cloud-native alternatives deliver faster time-to-value for mid-market and enterprise finance teams. Our analysis is based on verified user reviews, finance forums, analyst reports, and research based on vendor websites and product information.
If you’re a CFO or a senior member of the finance team facing an FP&A platform decision, you know this isn’t something that comes around often. It’s a once-in-a-few-years exercise and getting it right matters.
Chances are, Vena and Datarails have come up in your conversations, especially if your goal is to reduce reliance on spreadsheet-based FP&A. The promise from both these vendors is straightforward: modernize your planning and reporting workflows while keeping Excel at the center. In fact, the familiar spreadsheet interface is what often draws finance teams to these platforms in the first place.
But the decision between them isn’t straightforward at all. CFOs typically care about a few different things.
How quickly can you get value from the platform? Does governance scale with the addition of entities? What kind of AI capabilities can I really get (and not just the marketing promises)? How does the BI layer work when executives need dashboards? And then there’s the obvious one: total cost of ownership, especially when considering a multi-year commitment with a vendor.
This comparison is written for mid-market and enterprise finance leaders who need to move beyond basic spreadsheets but want to understand what they’re really getting.
We’ve cross-referenced user reviews from G2, Capterra, and other review sites with vendor documentation, analyst reports, and discussions from finance forums. The goal is to focus on practical impacts for teams running planning cycles, consolidations, and board reporting.
We’ll walk through how each platform handles Excel dependency differently, where their strengths actually show up in day-to-day work, and what limitations you should know about before signing a contract. Then we’ll talk about why the Excel-native approach to FP&A itself might be the bigger question you should be asking.
Vena review
Vena’s simple premise is that finance teams shouldn’t have to abandon Excel to get work done.
Core planning, budgeting, and modeling workflows happen directly in Excel through an add-in, which preserves the formulas and structures your analysts already use. For organizations that have spent years building Excel-based processes, this familiarity certainly reduces initial resistance to adoption.
The platform’s architecture is tightly integrated with the Microsoft ecosystem. For example, Vena relies on Power BI for executive dashboards and visual reporting, which, depending on your subscription, can be advantageous if your organization already uses Microsoft 365.
Vena connects directly with Power BI to extend Excel’s limited reporting capabilities. And if you have IT teams that know how to work with Power BI, Vena’s integration with it can make it easier to achieve consistent governance across the entire reporting stack.
On the other hand, if you’re not already using Microsoft 365, that dependency on Power BI can become a constraint. Finance teams without Power BI expertise are often dependent on IT teams (who may or may not have that expertise either) to build or modify their financial reporting dashboards.
“The dashboard they claim to have is basically Power BI embedded into Vena. You have to know how to write DAX formulas to really do anything with it. During the sale or demo, they’re going to make it seem very easy to do anything. Just ask them to set up a report in front of you from the start or ask them to deactivate the flags to uncover the complicated set up.” — Finance Director and verified Vena User
Implementation timelines run longer than most competitors. One frustrated enterprise finance manager shared on G2: “After a nine month implementation, we ultimately decided to stop the process after spending countless hours on it. Vena’s models are extremely rigid and couldn't accommodate our needs and requirements. Instead, they asked us to lower our expectations because the product simply couldn’t deliver. On top of that, they failed to integrate with our ERP, despite claiming that ‘dozens of users are already using it.’”
Users also note that performance degrades as model complexity increases, saying that “for large data, Vena lags, reducing the performance speed and efficiency” and “sometimes Vena feels a little slow when I have lots of data. I wish it could open faster when I am busy.”
As one reviewer explained: "Overall, the value feels pretty low since the system is really complicated, and every little thing you want to add requires paid support. In the end, we only implemented a fraction of what we originally planned."
What are Vena’s core strengths?
- Excel-native interface reduces adoption friction: Finance teams work in the spreadsheet environment they already know. The add-in preserves familiar formulas and modeling approaches while adding version control and audit capabilities.
- Consolidation for multi-entity operations: Vena handles intercompany eliminations, currency translation, and hierarchical rollups without extensive customization. This helps organizations that manage multiple legal entities get audit-ready consolidated results.
- Strong integration with Microsoft ecosystem: For companies already invested in Power BI, Dynamics, and Azure, Vena extends that infrastructure into FP&A. This means IT teams can apply consistent security policies and governance across the entire Microsoft stack.
- Workflow and approval governance: Budget cycles, approval hierarchies, and version control help larger organizations maintain oversight as planning becomes more distributed.
What are the primary concerns CFOs and finance teams have with Vena?
- Power BI dependency creates reporting bottlenecks: Executive dashboards and visualizations require Power BI expertise. Finance teams without dedicated BI resources struggle to build or modify reports independently, creating delays when stakeholders need changes in their reporting dashboards.
- Implementation timelines extend well beyond estimates: While Vena quotes 8-10 weeks, deployments commonly stretch to six months or more. Major model changes often require specialist support, even post-implementation. If you don’t already have that expertise in-house, you may need to hire a consultant.
- Performance degrades with complexity: It’s not uncommon for large data sets and complex models to crash in Excel. Similarly, because it works within the native Excel environment, Vena’s performance can also suffer as models grow in size and complexity. Refresh times can extend to several minutes, disrupting workflow during active planning cycles.
- Escalating total cost of ownership (TCO): The full cost of Vena often isn’t clear until after full implementation, when you factor in unexpected costs for professional services, higher support tiers, and any add-ons you end up needing to get the platform to work for you. Add to this Vena’s push for multi-year contracts, and you could end up getting locked into a substantial financial commitment before you’ve validated long-term fit.
When does Vena make sense?
Vena works best for mid-market to enterprise organizations already committed to the Microsoft ecosystem.
If your company runs on Microsoft Dynamics, uses Power BI for business intelligence, and has IT resources comfortable managing Microsoft infrastructure, Vena extends that investment into financial planning without introducing new technology stacks.
The platform fits companies that prioritize governance and process rigor over speed and flexibility. Organizations with complex consolidation requirements, say, multiple legal entities, intercompany eliminations, and multi-currency operations, benefit from Vena’s structured approach.
You will also need Windows machines for contributors and Power BI expertise for anyone building executive reports. If your organization lacks dedicated BI resources or runs a mixed Mac and Windows environment, the friction there might well outweigh the benefits.
For organizations that don’t use Microsoft products, Vena might still be worth considering, but it will likely require significant workarounds for finance teams to develop the types of reports executives need.
In either case, companies considering Vena should confirm that their stakeholders have the patience to absorb the opportunity costs associated with a lengthy implementation.
Datarails review
Datarails is built for finance teams that want speed without giving up Excel. The platform keeps planning and reporting inside the spreadsheet interface, allowing users to build their models, perform consolidations, and create reports without shifting to another environment. Like with Vena, that familiarity shortens adoption time and helps smaller finance teams modernize their FP&A without the complexity of an enterprise performance management (EPM) system.
The software comes with in-app dashboarding. Executives can view live dashboards directly in Datarails, turning consolidated numbers into quick board or investor stories without waiting for a BI developer.
For CFOs and finance executives who need to publish monthly reports fast, this integration reduces the friction that comes with a dependency on a BI tool.
However, there’s a trade-off in terms of depth and scale. Datarails’ visual layer is great for snapshot KPIs and variance bridges, but less flexible than enterprise BI platforms when you need heavy customization or multi-department data models.
A fund accountant noted on G2: “The platform isn’t flexible enough to build tables with multiple columns pulling from different data sources. In addition, when comparing actuals and budgets (e.g., monthly from Jan to Sep), there’s no option to show separate grand totals.”
While Datarails is effective in terms of reporting speed and accessibility, it’s not designed for highly complex driver-based forecasting or company-wide analytics. The dashboard functionality is limited compared to tools like Tableau, with users wanting more features in terms of graph types and customizability.
Beyond visualization constraints, the platform presents a steep learning curve for advanced features. That learning curve isn’t immediately obvious, though, because its Excel operations feel familiar to most finance teams. It’s not until you start working in Datarails that you run into the reality that you must learn a whole new proprietary syntax and platform-specific concepts before you can begin to use it effectively.
According to this user, “The initial setup and learning curve is difficult and I don’t believe the training videos are as helpful as they could be. This is because how you map your data is up to you, meaning that, whilst the possibilities are seemingly infinite, understanding how to get there could take you years to learn how to effectively use it.”
As you might expect with any Excel-based FP&A tool, Datarails’ performance degrades as complexity increases. The platform slows down noticeably as you add more sheets and data. Refresh times extend during planning cycles, and users experience the system getting bogged down when working with large datasets. While Datarails does work with Mac, some Mac users report that they had to switch to a PC for better functionality.
Integration issues are a constant complaint. Datarails offers significantly fewer connections than cloud-native competitors, creating data gaps for organizations with diverse tech stacks.
Datarails’ core strengths
- Excel familiarity without the manual work: Finance teams continue modelling and analyzing in the spreadsheets they already use. Datarails automates repetitive tasks like data refreshes, version control, and roll-ups, eliminating copy-paste work and ensuring one source of truth across contributors. Analysts spend more time interpreting results and less time managing spreadsheets.
- Native web dashboards for faster executive reporting: Built-in dashboards translate spreadsheet data into executive-ready visuals without separate BI setup. CFOs and business leaders can view KPIs, trends, and variance bridges directly from the browser. No Power BI, Tableau, or IT intervention required. While these dashboards aren’t as deeply customizable as full enterprise BI tools, they provide quick, polished readouts ideal for board packs and monthly business reviews.
- Strong automated consolidation for multi-entity operations: Datarails handles complex consolidations across subsidiaries, currencies, and accounting systems. For organizations managing multiple ERPs or QuickBooks files, the platform automates eliminations and currency conversions that previously took days of manual effort, producing audit-ready consolidated results in hours.
- Practical AI features embedded in reporting workflows: Datarails automatically generates plain-language summaries of financial results, while anomaly-detection features flag unusual movements or data quality issues. These additions help finance teams turn numbers into insights without advanced data-science skills.
What do Datarails users struggle with?
- Steep learning curve for advanced features: While basic Excel operations feel familiar, Datarails requires learning custom syntax and platform-specific concepts.
- Performance degrades as complexity increases: The platform slows down noticeably as you add more sheets and data. Refresh times extend during planning cycles, and some experience the system getting bogged down when working with large datasets.
- Basic dashboards limit storytelling capabilities: While native dashboards eliminate BI tool dependencies, the visualizations are limited compared to enterprise platforms. The report builder formats are basic, and building custom reports from scratch proves difficult.
- Limited integrations create data gaps: Integration issues are a constant complaint. Datarails offers significantly fewer connections than cloud-native competitors.
- Pricing opacity and higher-than-expected costs: Datarails doesn’t publish transparent pricing, and reviews indicate it’s more expensive than comparable FP&A options. The cost structure becomes clear only after implementation.
When does Datarails make sense?
Datarails is a good fit for SMBs and mid-market finance teams that live in Excel and want to stay there. And that may make sense, at least for a while, if your analysts have built years of institutional knowledge into spreadsheet models and are resistant to moving those to a whole new platform. Eventually, the limitations inherent in Excel will make that idea more palatable, as models begin to crash under the burden of increasingly large data sets and complexity.
In the meantime, Datarails can automate much of the manual work finance teams do without forcing a workflow change. You get version control and automated consolidations while your team continues working in the interface they know.
Datarails can also work well for finance teams that want to tell clear, visual stories to executives, without a dependency on BI tools or the expertise they require. However, enterprises needing advanced modeling, scenario depth, or elaborate data storytelling out of the gate may find its simplicity limiting.
If you’re managing complex data blending across multiple systems, running a mixed Mac/Windows environment, or need sophisticated analytics and storytelling, the platform's limitations become constraints rather than acceptable trade-offs.
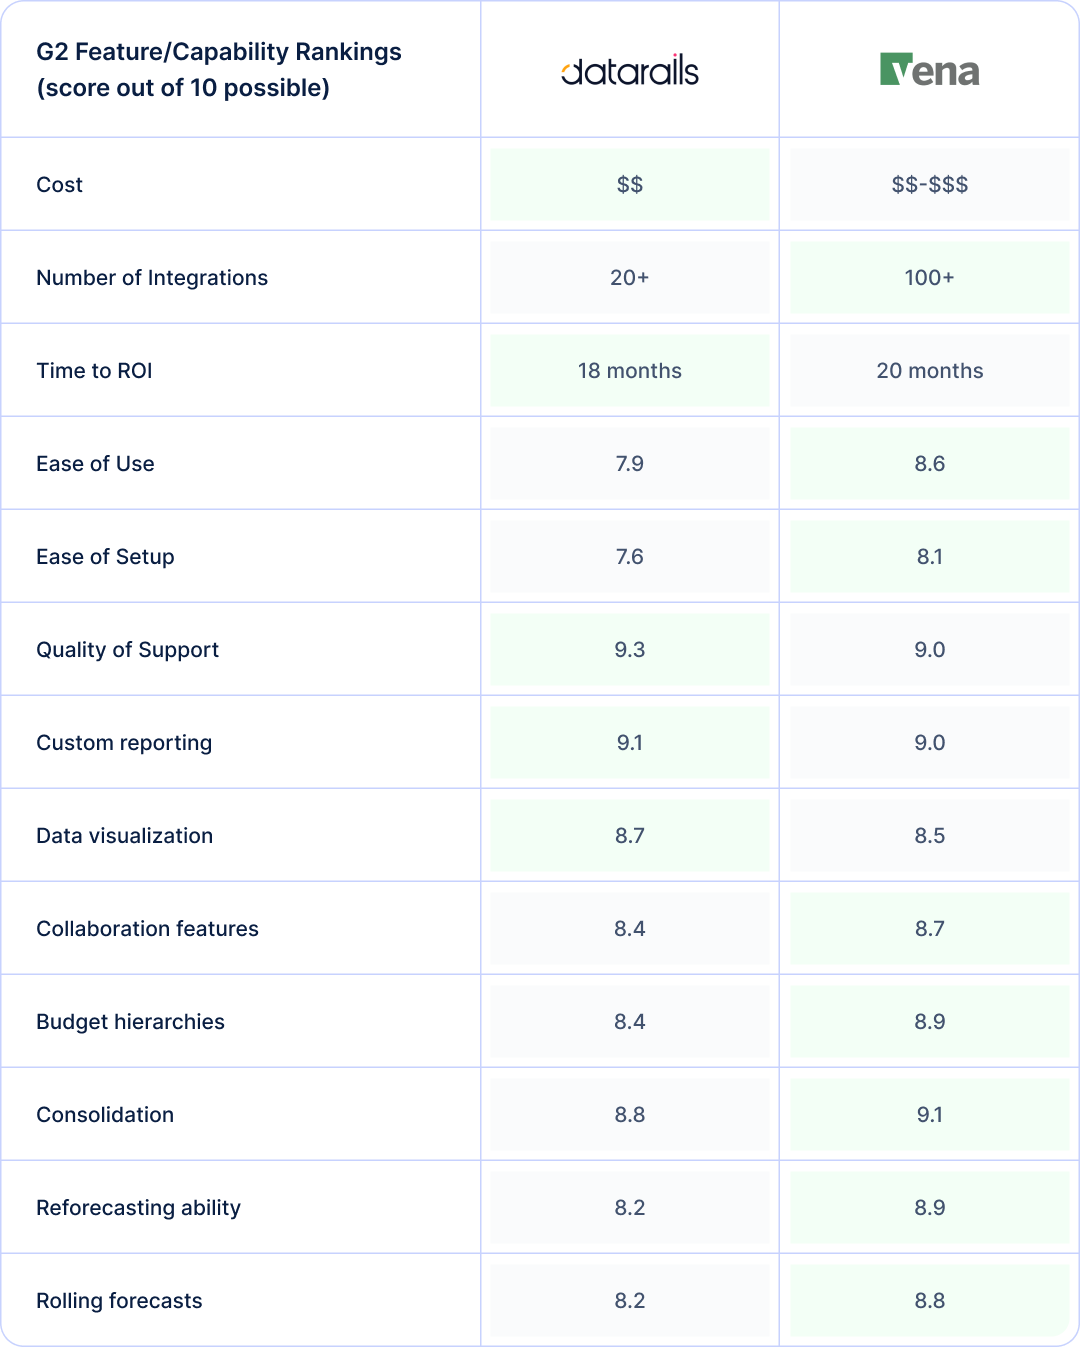
Vena vs. Datarails: direct feature and experience comparison
Both platforms keep Excel at the center but require different trade-offs.
Vena scores higher on budgeting depth, consolidation, and reforecasting according to G2 ratings. The platform handles driver-based planning and rolling forecasts well, particularly for structured planning processes.
Datarails prioritizes speed, automating consolidation from existing Excel models rather than forcing rebuilds. Users appreciate this for basic budgeting and reporting, but advanced scenario modeling feels limited.
The bigger challenge for both tools is maintaining model integrity as complexity grows, which could potentially lead to uncertainty about accuracy during board meetings or reforecasting cycles.
On consolidation, Vena demonstrates clear advantages for multi-entity operations. It handles intercompany eliminations, currency translation, and hierarchical rollups with logic that produces audit-ready results. Datarails automates consolidation effectively for straightforward reporting but shows limitations when data blending requires sophisticated rules or drilldowns extend beyond basic transaction visibility.
On the collaboration front, Vena reflects mature workflow approvals, audit trails, and change controls that support compliance. This works well for regulated companies with strict internal controls. Datarails offers a streamlined experience with simpler permissions, lighter workflows, and easier approval processes. This fits smaller teams with basic governance needs.
Vena’s Copilot offers conversational queries and automated reports with some trend flagging. Datarails bundles ‘Genius’, a chatbot, automated insights, and narrative storyboards. Currently, the AI features in both feel like additions to spreadsheet workflows rather than a fundamental reimagining of how FP&A should work.
Where both Vena and Datarails fall short for dynamic finance teams
Both platforms share the same basic constraint—instead of replacing Excel, they’re built with a dependency on it. As such, they both inherit many of the limitations inherent in Excel in addition to bringing their own to the mix, ultimately impacting their scalability.
According to user reviews, implementation timelines with both tools often run longer than expected with a higher total cost, after factoring in professional services, support tiers, and add-ons.
The Excel foundation creates friction in day-to-day work, too. Mac users face compatibility issues, using Google Sheets requires workarounds, and performance degrades as model complexity increases.
For finance teams managing volatile markets that require frequent reforecasting, these constraints reduce agility when you need it most. Both platforms prioritize familiar workflows over adaptability, which only works until your business outgrows what spreadsheets can handle.
Excel‑native environment constraints
The Excel-first approach of both Vena and Datarails assumes everyone works on a Windows computer and uses Excel, which creates immediate friction for distributed teams. With Datarails, Mac users routinely encounter compatibility issues and reduced functionality, and while using Vena on a Mac is possible, it requires integration (and a subscription) to Microsoft 365. In addition, Google Sheets users report needing workarounds.
Organizations with remote teams spanning different operating systems may discover these limitations only after purchase, when contributors can’t access the planning cycles they need to participate in.
One of the most common reasons finance teams start looking at FP&A tools in the first place is the scalability issues inherent in Excel. For these teams, choosing an Excel-based FP&A solution isn’t a real solution because it imposes the same limitations—and at a much higher cost.
As businesses scale, their Excel-based models grow in both size and complexity. Inevitably, they begin to encounter performance issues and their models become fragile. So, it’s not surprising that Vena and Datarails users report that their platforms slow down with large datasets or complex workbooks. They also inherit Excel’s version control challenges. While both platforms add workflow layers on top, the underlying model structure still relies on spreadsheet logic that can break when users make unexpected changes.
Time-to-value and ongoing maintenance burden
Implementation timelines tell only part of the story. Vena deployments commonly extend to six months or more, with users reporting that significant changes often require specialist support even after go-live.
The administrative friction compounds over time. Users consistently mention frustrations with scenario cloning and model duplication, and updating driver logic across multiple versions, all of which require more manual effort than users expect. Reviews mention simple operations becoming multi-step processes that slow down planning cycles.
This user explained on G2, “One of the main challenges was how siloed the workspaces were. While Datarails offers strong functionality for managing financial data, the separation between workspaces made it difficult to collaborate across teams or share insights seamlessly. This often resulted in duplicated efforts and limited visibility into what other teams were working on.”
Using Datarails’ advanced features requires learning its custom syntax and platform-specific concepts, which can take a lot of time up front. For lean finance teams, this is a barrier for analysts looking for fast productivity gains and time for more strategic work. When market conditions shift and you need to restructure models quickly, both platforms force you back to consultants or into time-consuming workarounds.
If you’re an organization looking for agile planning, the time both Vena and Datarails require for model maintenance can become a competitive disadvantage. You need a platform that adapts as fast as your business changes, not one that requires specialist intervention for structural updates.
Reporting trade‑offs that slow alignment
Vena’s Power BI integration creates a dependency that looks different depending on your resources. Finance teams without BI expertise find themselves waiting on IT to build or modify dashboards, which delays the insights executives need for decision-making.
Datarails eliminates that BI bottleneck with native dashboards, but the trade-off shows up in customization limits. Users note that while the dashboards handle standard monthly reporting well, creating compelling narratives for board meetings or investor updates pushes against the platform’s visualization constraints.
Both approaches create maintenance overhead that compounds over time. Board pack preparation still requires manual effort, either wrestling with Power BI development or working around Datarails’ limited formatting options.
On Capterra, this business analyst said: “There are limitations to the types of dashboards we need to create in the system. Some files we are unable to aggregate because of the data type, which is crucial to a number of our reports. The file mapping can sometimes get confusing when there are additional columns that have been added and we need to reconfigure the mapping, but our historical data does not have the exact same data.”
When executives ask for different cuts of data or new visualizations mid-quarter, neither platform makes those changes easy. For CFOs who need to pivot reporting quickly based on board feedback or market changes, these constraints slow down the alignment cycle when speed matters most.
How Drivetrain outperforms Vena and Datarails
Drivetrain is a comprehensive, AI-native FP&A platform that took a fundamentally different approach by building a cloud-native platform from the ground up rather than layering automation on top of Excel.
This architectural difference addresses the core limitations that both Vena and Datarails inherit from their spreadsheet foundations. Drivetrain eliminates the dependency on Excel entirely while preserving a spreadsheet-inspired interface that finance teams find intuitive.
While Vena and Datarails leverage Excel for their calculation engine, under Drivetrain’s hood, there’s a proprietary and powerful calculation engine that offers multi-dimensional modeling without limits and without performance issues. Models refresh in seconds rather than minutes, regardless of data volume. In addition, unlike other powerful financial modeling platforms, Drivetrain doesn’t require users to learn a custom language or formula syntax. With Drivetrain’s native AI capabilities, users can create familiar, Excel-like formulas using plain English prompts.
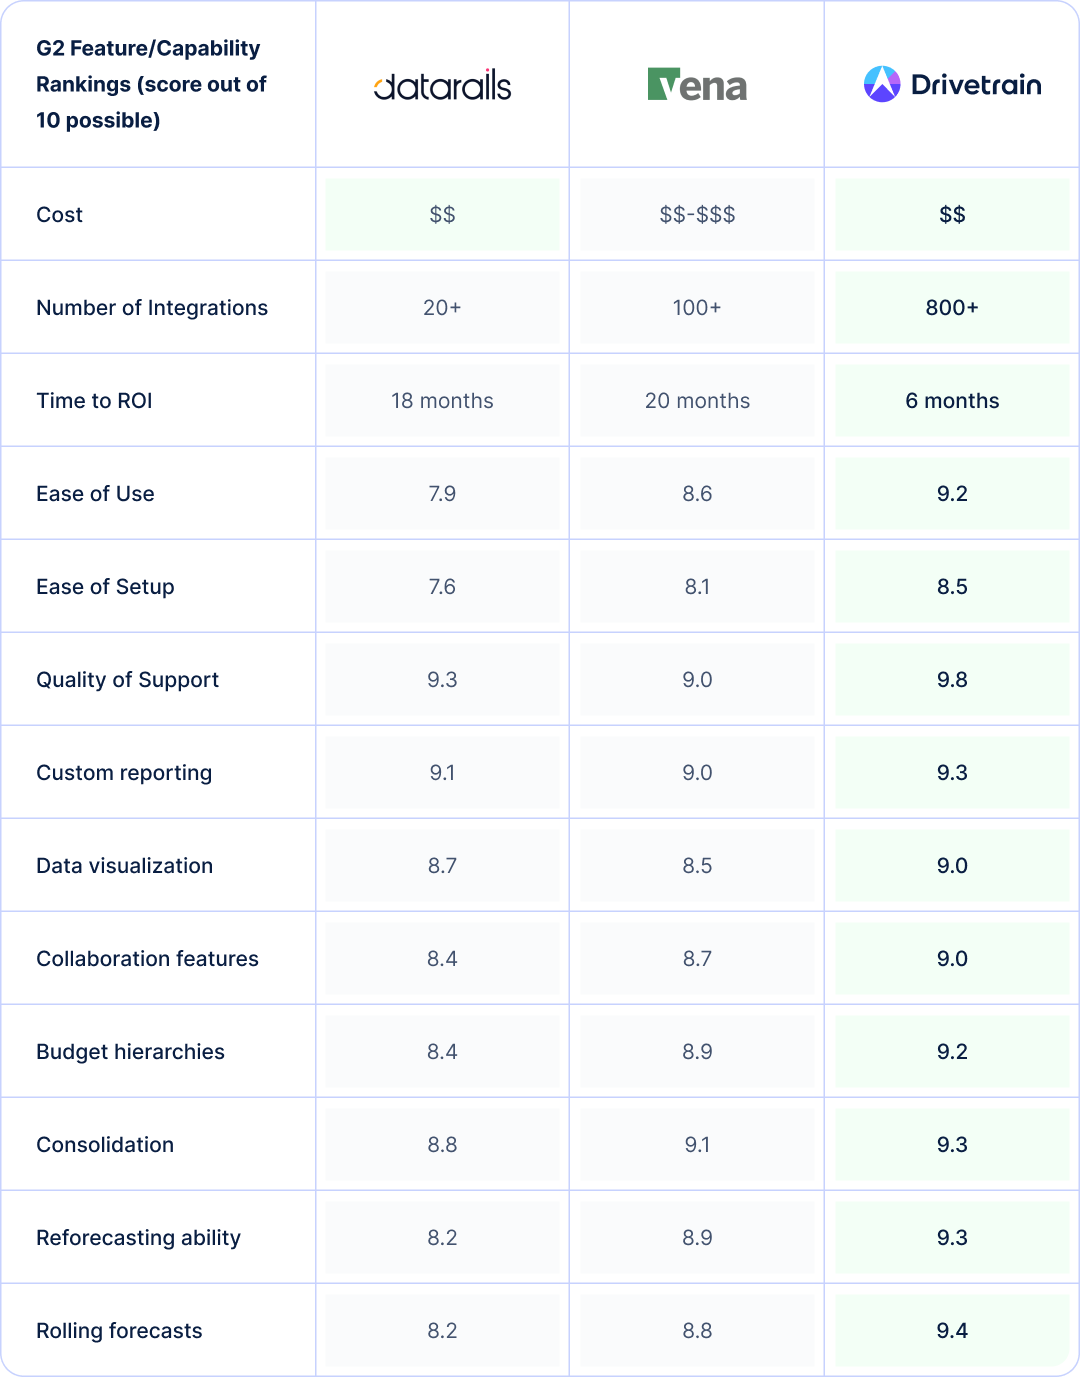
Drivetrain outscores both competitors on critical planning capabilities, including budget hierarchies, consolidation, reforecasting ability, and rolling forecasts. Its native AI extends these capabilities even further with predictive analytics and the ability to create baseline models in seconds.
The platform offers 800+ native integrations, far exceeding what Vena and Datarails provide, which eliminates data consolidation bottlenecks. Drive AI builds on Drivetrain’s robust integrations to further streamline data operations with the ability to transform your data into model-ready formats within seconds of it flowing into the platform. It also leverages machine learning to provide anomaly detection that proactively flags issues before they impact your models.
Drivetrain is an AI-native FP&A platform, meaning its AI capabilities are built into its core architecture, not added on top of spreadsheet workflows.
Modern workflows that scale far beyond the limits of Excel add-ins
Drivetrain runs entirely in the browser, eliminating the environment constraints that plague Excel-native platforms. Mac users, Windows users, and teams working from Chromebooks all access the same cloud-based interface with identical functionality. There’s no add-in to install or compatibility issues to troubleshoot. Remote teams spanning different operating systems collaborate seamlessly without the friction of figuring out who can participate in planning cycles.
As this SVP of finance put it: “This is the first platform I’ve used where I’ve felt comfortable getting rid of the ‘backup’ Excel model,” while this user simply stated: “Everything you can do in Excel, you can do better in Drivetrain (and then some).”

Drivetrain's cloud-native architecture means models are refreshed in seconds regardless of data volume or complexity. You can build multi-dimensional models with unlimited hierarchies without worrying about Excel’s row limits or the slowdowns that come from adding sheets.
Version control happens automatically in the background—no more “Final_v3_FINAL_revised.xlsx” files or wondering which version stakeholders are looking at. Every user always works from the current model with a complete audit trail of who changed what and when.
The platform handles the collaboration challenges that spreadsheets were never designed to solve. Multiple users can work in the same model simultaneously without conflicts or locked cells. Role-based permissions control access at a granular level, and workflows route approvals automatically without email chains.
This member of a mid-market finance team shared on G2: “As a Finance team member I wanted a tool that serves all of my forecasting & reporting needs, but also wanted something that would allow for cross-functional collaboration. Drivetrain’s reports are perfect for this with features like tagging people in comments, user level restrictions, customizable & visually appealing graphs, charts & tables.”
As your business scales, the platform scales with you rather than requiring consultant-driven workarounds to manage complexity that exceeds what Excel can handle.
Weeks‑to‑value and ease of use that eliminates the “consultant tax”
Implementation timelines are dramatically shorter with Drivetrain than with either Vena or Datarails. Drivetrain’s approach to implementation is designed to reduce time-to-value (TTV) with high-touch onboarding that includes implementation specialists who understand FP&A, a comprehensive knowledge base, self-guided training, and an AI assistant available across the platform to answer questions you have about using it. You also get a dedicated CSM during and after implementation to provide help when you need it, eliminating any need for external support.
Faster TTV and no expensive external support mean a shorter payback period on your FP&A software investment. Most teams reach ROI within six months, compared to the 18–20 months common for Vena and Datarails.
G2 users rate Drivetrain higher for ease of use compared to both Vena and Datarails. Users get a familiar, spreadsheet-like UI and formulas that look much like those they are accustomed to working with in Excel—no special syntax to learn or training needed, just an intuitive platform that users can start working with on day one.
Finance teams own their models directly, making structural updates as business conditions change without opening tickets or waiting for specialists. Scenario cloning, driver updates, and structural changes happen through the UI without consultant delays. Finance teams own their models completely, adjusting as business conditions change without the multi-week bottlenecks that plague Excel-native platforms.
One user shared: “Once your drivetrain model is built, it is incredibly easy to maintain and use. The customer support team has been incredible and made implementation a breeze. The product itself is super comprehensive and allows us to see executive dashboards and wow investors with our forecasting and scenario building.”
Executive‑ready reporting with integrated, practical AI workflows
Drivetrain eliminates the reporting trade-off by building visualization capabilities directly into the platform.
You don’t need a Power BI license or Tableau expertise to create executive dashboards; the native reporting layer handles everything from monthly board packs to ad-hoc stakeholder requests. Customizable, interactive dashboards let finance teams build sophisticated visualizations without waiting on BI resources or settling for basic formatting.
One user noted: “Users can conveniently generate comprehensive reports with multiple metrics in a single view, organize their views using folders, perform detailed analyses by drilling down into individual metrics and effortlessly create Boards from Views. These outstanding features enhance the platform's overall functionality.”
Drive AI transforms how teams create board materials. Any user can ask questions in natural language and instantly get charts they can copy directly into presentations. Instead of spending hours building variance analyses or hunting down anomalies, the AI proactively flags unusual patterns across revenue, expenses, and headcount, then explains what's driving the variance. Forecast assistance uses machine learning to identify trends and suggest adjustments, turning what used to be a multi-day exercise into a conversation.
This practical approach means executives get the storytelling depth of enterprise BI tools without the cost of a license and the expertise to use it. Finance teams spend less time formatting presentations and more time discussing what the numbers mean.
A decision framework for CFOs
Choosing FP&A software requires looking beyond feature checklists to understand how the platform will perform as your business evolves.
Start by assessing your current state honestly: How many entities are you consolidating today, how often market conditions force you to reforecast, and whether your planning cycles are predictable or constantly shifting? The platform that works for stable annual budgeting breaks may not offer the agility needed for weekly scenario updates.
Technical resources matter more than most CFOs initially realize. If your finance team lacks dedicated BI support or an IT partnership, platforms that depend on external tools for reporting will create bottlenecks exactly when executives need dashboards.
Conversely, if you’ve invested heavily in a specific BI ecosystem, breaking that alignment has costs beyond just the software switch. Evaluate whether your team can own model changes independently or whether you’ll be opening tickets to consultants every time business logic shifts.
Implementation timeline and total cost of ownership deserve scrutiny. A six-month deployment that requires specialists for ongoing changes will always cost more than the contract value suggests. Factor in the opportunity cost of decisions delayed while you wait for the platform to go live.
The AI conversation requires separating marketing from substance. Conversational chatbots that answer basic questions differ fundamentally from platforms that generate models automatically, detect anomalies proactively, and learn from your planning patterns.
Ask vendors to demonstrate AI capabilities live with your data rather than accepting canned demos, and evaluate whether the features solve real workflow problems or just add surface-level convenience.
Consider your growth trajectory realistically. If you’re adding entities through acquisition, expanding internationally, or scaling headcount rapidly, the platform needs to handle increasing complexity without performance degradation or architectural limitations. Excel-native solutions optimize for familiarity over scalability. That trade-off works until it doesn’t. Migrating platforms mid-growth is exponentially more disruptive than choosing the right architecture initially.
Choosing your FP&A partner
Drivetrain is a solid choice for mid-market businesses and enterprises that need to scale beyond what spreadsheets can handle. The cloud-native architecture eliminates Excel’s constraints while preserving an intuitive interface that finance teams adopt quickly.
You get enterprise-grade capabilities, unlimited multi-dimensional modeling, sophisticated consolidation capabilities, and AI-powered insights, with implementation timelines measured in weeks rather than months.

If you need an FP&A solution that grows with your business instead of holding it back, book a demo with Drivetrain to see how modern planning infrastructure outperforms Excel-native alternatives.
Frequently asked questions
No. Like all Excel-native FP&A tools, Vena and Datarails are only “cloud-based” in the sense that they centralize data and workflow management. Both add-ins enable connection to the cloud for storing data (models, reports, etc.), but they require users to install Excel on their physical desktop to access their FP&A features.
For organizations looking for a web-based FP&A platform easily accessible to all users—including those with Macs or Chromebooks or those working with Google Sheets—neither Vena nor Datarails will meet that need.
It’s important to note that Microsoft Office 365 Online, which offers a web-based version of Excel, offers little support for the advanced Excel add-ins that give Vena and Datarails their planning functionality. Accessing that functionality will require the desktop version of Excel, on top of any investment you may have in Microsoft 365, especially for complex workflow and automation.
Vena scores higher on G2 for rolling forecasts (8.8 vs. 8.2) and reforecasting ability (8.9 vs 8.2). However, user reviews mention friction around scenario cloning and model updates that slow down planning cycles.
Datarails prioritizes speed but shows limitations as scenario complexity increases, and performance degrades as you add more sheets.
Test how each handles scenario cloning with your actual model structures and whether refresh speeds hold up under your data volumes before deciding.
Vena implementations commonly stretch to six months or more despite shorter estimates, with users reporting deployments taking eight months or longer. Major model changes often require specialist support even after go-live.
Datarails goes live quicker, but users report needing ongoing support for advanced features and structural updates.
Ask vendors for timelines from similar customers and get clarity on what model changes your team can handle independently versus what requires paid services.
Vena offers a Power BI connector and commonly uses Power BI for executive dashboards. Power BI requires technical expertise to build or modify reports. Without BI skills or IT support, you’ll wait days or weeks for simple report changes.
Ask Vena to demonstrate building a custom executive report from scratch during your demo to see what’s involved. And, consider the extra cost of a Power BI license if you don’t already have access to it through a Microsoft 365 subscription.
Datarails’ built-in dashboards eliminate BI tool dependency, which works well for teams without dedicated BI resources. However, users describe the visualizations as basic with limitations on customization and cross-system data blending.
The platform handles straightforward financial reporting but struggles with sophisticated storytelling.
We’d advise piloting an actual board pack creation during evaluation to test whether drill-down paths, formatting options, and visualization capabilities meet your needs.
Beyond licenses, implementation hours that exceed estimates, professional services for integrations and configuration, premium support tiers, change request fees, and internal FTE time for platform administration.
Multi-year contracts lock you in before validating fit. Build a TCO model accounting for both steady-state operations and frequent-change scenarios where market volatility forces regular model updates.
Users commonly report costs that far exceed expectations. So, it’s important to consider how your needs will evolve over the length of the contract and factor in the cost of additional support or added features that might be needed to accommodate them.
Both Vena and Datarails are optimized for Windows desktop Excel, creating friction for distributed teams. Mac users encounter compatibility issues and reduced functionality. Google Sheets users need workarounds or find themselves locked out of core planning workflows.
User reviews note performance problems on non-Windows devices. Before committing, validate add-in performance across all devices your team uses and identify what compromises Mac or Google Sheets users will face.
If you run a mixed environment, test planning workflows on each platform to ensure all contributors can participate.
The use of AI in finance is evolving quickly, making it difficult to determine the real value of the AI features a vendor offers. In our recent report, The State of AI in FP&A, we learned that more than 80% of finance teams are using AI, but mostly for use cases that are more operational than strategic. This will undoubtedly shift in the future.
Ask vendors to demonstrate these capabilities live with your actual data, not canned demos. Evaluate whether the AI explains its recommendations (not just black-box outputs), whether you can edit and override suggestions easily, and how outputs integrate into your existing reporting without manual rework.
Vena’s Copilot and Datarails’ Genius offer conversational queries and basic insights, but neither delivers the predictive forecasting or proactive anomaly detection that an AI-native platform like Drivetrain can.

.webp)


