.svg)
.svg)

Cube and Datarails are both Excel-native FP&A platforms that promise to modernize financial planning without abandoning spreadsheets. This article breaks down what that actually means for your finance team, how each platform handles core FP&A workflows, based on the real-world strengths and limitations reported by verified users.
You’ll find a direct comparison of features, integration depth, and time-to-ROI, along with a detailed look at why Excel-native architecture creates ceilings around automation, collaboration, and scalability.
.svg)
.svg)

.svg)

“Excel isn’t going anywhere.” That’s been the rallying cry for many FP&A software vendors for ages.
The idea was simple: build a platform around spreadsheets rather than trying to replace them. The logic made practical sense, too: finance teams live in Excel, so why force them to abandon their most familiar tool?
Cube and Datarails have been among the frontrunners in this Excel-native category, promising to modernize FP&A workflows.
For a while, mid-market companies managed with what these (and other) tools could provide. They got centralized data connections, version control, and collaboration features, all while staying in their spreadsheet comfort zone.
Implementation was comparatively faster than traditional enterprise platforms. Finance leaders could say that they had ‘upgraded’ to a better system.
However, the on-the-ground realities are rapidly shifting. Forward-looking CFOs and finance teams who initially embraced Excel-native tools are now asking harder questions about scalability, integration reliability, AI capabilities, and long-term architecture.
Our user research shows a pattern: teams that started with spreadsheet-centric platforms are hitting walls around complex workforce planning and true automation depth.
The conversation is no longer about ‘Excel vs. no Excel’. It is now something more nuanced: when does spreadsheet-native architecture become a liability rather than an advantage?
And more importantly, what does the next generation of FP&A infrastructure actually look like for teams planning beyond their next fiscal year?
Cube software review
Cube positions itself as the path of least resistance for finance teams ready to move beyond raw Excel but not ready to abandon spreadsheets entirely. The platform wraps centralized data management and workflow automation around Excel and Google Sheets through its add-in.
For mid-market teams where spreadsheet fluency runs deep and IT resources run thin, this approach still has its appeal.
Implementation typically takes about two months without requiring consultants; that’s the pitch, anyway. The reality is more varied. Some teams report being live in weeks with CSM support. Others describe implementations dragging past eleven months with misaligned expectations between sales and delivery.
The difference often comes down to data complexity and ERP configuration. Users report that while integration with more standard ERP setups can go smoothly, others that are more complex often result in recurring issues with syncing data, requiring manual workarounds and creating frustrating delays during the monthly close.
The ROI timeline sits at around 11 months, which is longer than some competitors. The familiar interface that eases adoption can also slow the process transformation that drives real value.
On the total cost of ownership (TCO), Cube’s mid-range pricing is accessible compared to most enterprise platforms. But factor in the time your team spends formatting retrieved data for non-finance stakeholders or working around integration gaps, and you’ll see that there are less obvious costs that add up fast.
Cube works best for companies with small, spreadsheet-native finance teams and relatively straightforward planning needs. It works fine when your primary pain point is version control chaos and you need centralized collaboration without retraining everyone on a new interface.
What are Cube’s core strengths for FP&A?
- Spreadsheet-native flexibility across Excel and Google Sheets: Cube’s add-in works with both platforms, which matters for organizations running GSuite. Users can pull data and build models without leaving their preferred spreadsheet environment.
- Consolidation without the complexity of enterprise solutions: Cube serves as a lighter-weight replacement for enterprise-level FP&A solutions. Users get centralized data, version control, real-time reporting, and multi-user collaboration without the implementation overhead and learning curve that enterprise tools demand.
- Operational and transactional data in one place: The platform pulls financial and operational data together, enabling analysis at both consolidated P&L level and transaction-level detail.
- Low learning curve for spreadsheet-fluent teams: The functionality mirrors how pivot tables work, so finance professionals pick it up quickly without specialized training.
What are the main issues users run into with Cube?
- Performance struggles under load during critical periods: The platform slows down noticeably during month-end close and quarter-end processes when demand peaks. Data imports take longer than expected, refreshes lag, and what should ideally be a quick turnaround on financial packages gets delayed by hours or more.
- No simultaneous loading for team workflows: Two teammates cannot load data at the same time. One person has no other option but to wait for the other to finish. This constraint compounds as teams grow.
- ERP integration gaps, especially with NetSuite: Users report ongoing sync failures between Cube and NetSuite that never fully get resolved. Some teams give up on automated connections entirely and resort to manual uploads each month.
- Limited dashboard customization and visualization: The reporting output requires significant formatting work before it’s presentable to non-finance stakeholders. Data retrieval is fast and accurate, but the default presentation lacks polish.
When does Cube make sense?
Cube fits best when your finance team lives in spreadsheets and wants to stay there, but you need more guardrails. You are drowning in versioning problems and losing time reconciling conflicting workbooks. The pain is real, but so is the resistance to learning an entirely new platform.
The ideal buyer profile skews toward companies with small finance teams operating Excel on Windows desktop or using GSuite. Your planning needs are straightforward—think annual budgets, quarterly forecasts, and departmental expense tracking. You’re not running complex multi-entity consolidations, sophisticated allocation logic, workforce planning models with dozens of variables, or complicated multi-currency reporting across international subsidiaries.
Cube also makes sense when IT involvement needs to be minimal. If you don’t have dedicated technical resources and need finance to own the implementation end-to-end, the guided onboarding and hands-on CSM support become genuinely valuable. Teams that previously struggled with EPM platforms often find Cube’s lighter lift more manageable.
Your ERP also matters more than you might expect. Companies on QuickBooks or simpler accounting systems report smoother experiences. If you’re running NetSuite with customized configurations, you’ll need to budget extra time for integration troubleshooting or plan for manual uploads as a fallback.
Datarails software review
Datarails takes a slightly different approach in the Excel-native FP&A category. Like Cube, its core planning and modeling workflows run through an Excel add-in. But unlike Cube, Datarails offers native web dashboards designed for executives and report consumers.
Finance teams still build and maintain models in Excel, while leadership gets a browser-based view of the outputs. It’s a hybrid architecture that tries to serve both audiences.
Implementation runs about four months, longer than Cube’s typical timeline. Users like its data mapping functionality and workflow features that let you assign tasks to multiple stakeholders. The consolidation capabilities help when you’re pulling reports from various sources and need everything to update automatically.
But the platform has a steep learning curve that catches many teams off guard. Users describe it as unintuitive, with training videos that don’t quite bridge the gap between possibility and practical execution. For example, data mapping is highly customizable; however, that flexibility becomes a double-edged sword. You can build almost anything, but figuring out how takes longer than expected.
The Excel add-in itself creates friction. Workbooks with multiple tabs load slowly and refresh sluggishly. Mac users face a more serious problem: the add-in causes equations to break, displays ‘busy’ errors, and has cost people entire days of work. If your team includes Mac users, this is a fundamental compatibility issue that requires workarounds or forces standardization on Windows.
Users and teams with intricate financials have reported that they need in-house data analysts to make the platform work effectively. The siloed workspace architecture makes cross-team collaboration harder than it should be. The dashboard and report builder feel basic when you’re trying to present polished visuals to the board.
The ROI timeline stretches to 18 months according to G2 data, significantly longer than competitors. That’s a substantial commitment before you see measurable payback, especially for mid-market teams under pressure to demonstrate quick wins.
What are the key strengths Datarails offers for finance teams?
- Structured workflows for multi-stakeholder budgeting: Datarails lets you assign tasks to department heads, track their submissions, and review everything before finalizing reports.
- Data mapping that consolidates disparate sources: The platform pulls reports from various systems into a structured table setup accessible throughout Datarails and Excel. Once mapping is configured correctly, everything updates automatically.
- Web dashboards for executive consumption: Unlike purely Excel-dependent tools, Datarails provides browser-based dashboards for leadership. Finance teams build and maintain models in Excel while executives view outputs without needing the add-in or spreadsheet access.
- Drillable data for faster analysis: Users can dig into the numbers without switching between systems or rebuilding queries. Widget creation becomes straightforward once your data mapping is in place. You can also track version changes and share data across user groups, supporting scenario analysis without the usual copy-paste chaos.
What are the biggest limitations finance teams run into with Datarails?
- Mac compatibility is a serious liability: The Excel add-in breaks on Mac, causing equations to display “busy” errors and, worse, costing users entire days of lost work. Mind you, this isn’t occasional bugginess; it’s a fundamental platform issue. Teams with mixed Windows and Mac environments need to either force standardization or accept that some users will have a degraded experience.
- The learning curve is steeper than most FP&A tools: Users describe the platform as unintuitive, with training materials that don’t bridge the gap between what’s possible and how to actually get there. Because data mapping is so flexible, you’re essentially building your own system, which means making plenty of mistakes before you understand how everything connects.
- Siloed workspaces limit cross-team collaboration: While Datarails handles individual finance workflows well, the separation between workspaces makes it difficult to share insights or collaborate across teams. This leads to duplicated efforts and limited visibility into what other departments are building.
- Complex financials require in-house technical expertise: Simpler companies do fine, but organizations with intricate charts of accounts structures or multiple entities often need a dedicated data analyst to make Datarails work effectively.
- Dashboard and report formatting feel basic: Users note that the report builder layouts lack polish, and customized formulas require tedious workarounds. If you’ve grouped dimensions together, formulas need to pull each dimension individually rather than referencing the parent. Every new account code means adjusting formulas manually.
When does Datarails make sense?
Datarails fits organizations that need structure around chaotic multi-stakeholder budgeting processes. If your monthly forecasting involves chasing inputs from department heads via email, losing track of who submitted what, and manually consolidating everything, it might be a good solution.
The ideal buyer runs a Windows-dominant environment with minimal/no Mac users. Your finance team should be comfortable with Excel and willing to invest significant time learning a new system. The payoff exists, but it comes months or years down the road rather than weeks.
If you’re running multi-entity consolidations, unusual accounting structures, or intricate intercompany transactions, you’ll likely need an in-house data analyst to bridge the gap between what the platform offers and what your business requires.
The 18-month ROI timeline reflects the complexity built into the learning curve and its impact on adoption. For a software designed for finance teams that don’t want to give up their spreadsheets, it can take a long time before they are able to use it effectively.
If you’re a CFO who needs quick wins to justify your software spend, Datarails probably isn’t the right fit.
Cube vs. Datarails: How do they compare?
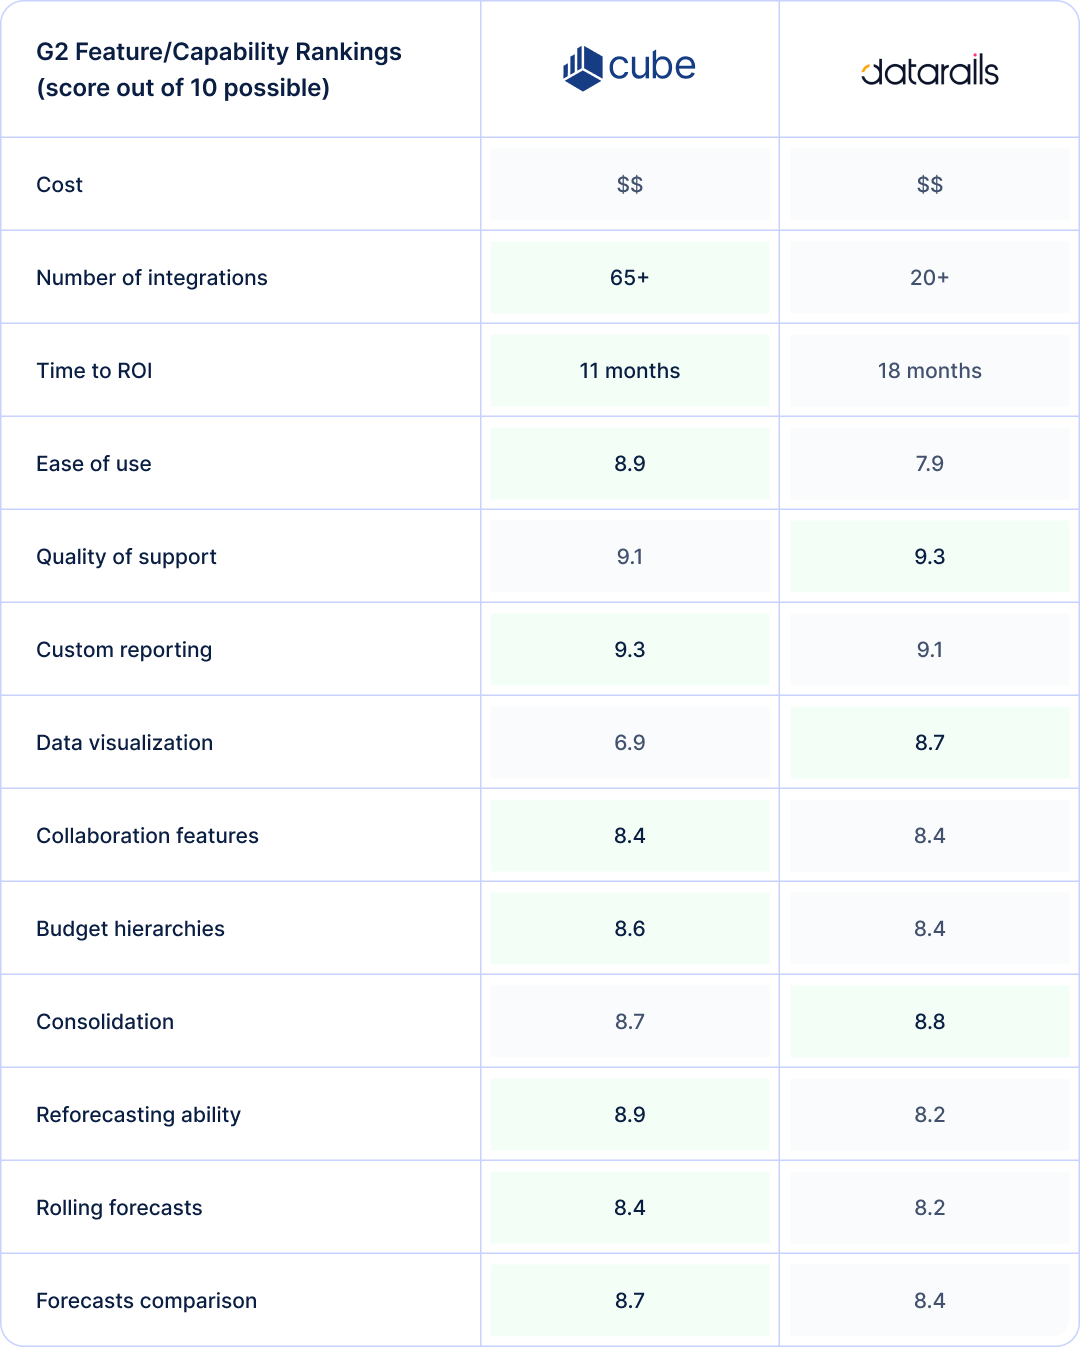
Both platforms occupy the same price tier and promise similar outcomes: modern FP&A without abandoning Excel. But the G2 ratings reveal meaningful differences in where each tool excels. Cube scores notably higher on ease of use, which aligns with user feedback about its intuitive, pivot-table-like interface.
Datarails demands more upfront investment in learning, though users who push through it report good results. The ROI timeline reflects this difference: Cube typically delivers measurable value months earlier than Datarails.
Integration coverage tells another story. Cube offers significantly more native connectors, which matters for mid-market companies stitching together multiple systems. Datarails has fewer out-of-the-box integrations, though its data mapping flexibility can compensate for teams willing and able to configure custom connections.
On core FP&A capabilities—reforecasting, rolling forecasts, scenario comparisons—Cube edges ahead across the board. But Datarails wins on data visualization, offering better dashboarding for executive consumption. If your primary use case involves presenting polished visuals to leadership, that difference matters.
The AI story is underwhelming for both platforms. Datarails markets its “FP&A Genius” chatbot for natural language queries about financial data, and Cube has begun adding AI-assisted features.
But user feedback suggests neither has delivered deep automation yet. Most automation remains surface-level rather than transformative. For teams prioritizing AI capabilities, both Excel-native platforms lag behind AI-powered FP&A solutions.
Collaboration features score identically, though the experience differs. Cube struggles with simultaneous users loading data at the same time, while Datarails offers structured workflows but siloes workspaces in ways that limit cross-team visibility. Neither platform has fully solved collaborative planning at scale.
Where do Cube and Datarails fall short for dynamic finance teams?
Both Cube and Datarails solve problems for finance teams that want to build on their existing spreadsheets.
However, as organizations scale and finance functions evolve, the architectural decisions that made these platforms accessible—primarily their deep Excel dependency—become the same decisions that limit their ceiling.
Our user research surfaces a consistent pattern: teams that adopted Excel-native tools often encounter challenges in terms of automation depth, integration reliability, and governance capabilities.
Excel-dependency limits true digital transformation
The promise of Excel-native FP&A is that finance teams keep working in their most familiar environment. But that familiarity soon becomes a constraint.
Both platforms route their core workflows through Excel add-ins, which means they inherit spreadsheet limitations around performance, collaboration, and automation.
Cube users report that the Excel foundation creates friction precisely when it matters most. One user described the reporting limitations: “While the biggest upside was having an excel based system, it would be nice if there is a way for non finance users to pull budget to actuals in the cube online dashboard.”
Another noted the formatting burden: “Retrieving data to produce reports is quick & accurate, but takes a lot of formatting to be presentable, especially to users outside of Finance.”
Datarails faces similar challenges, compounded by platform compatibility issues. The Mac experience is particularly problematic: “One of the largest issues that was faced during the implementation for our organization was the disruption caused from the Mac download of Data Rails. Because of this, many of the equations that were created on the Windows version were now named 'busy' and some employees lost all their work for the day.”
User reviews reveal a broader pattern here. Over-reliance on the spreadsheet “comfort zone” slows digital transformation and limits true automation. Teams replicate their old Excel habits inside these platforms rather than fundamentally reimagining their FP&A processes—a core requirement for transformation.
Integration and workflow gaps hinder operational efficiency
Modern finance stacks involve multiple systems—ERPs, CRMs, HRIS platforms, and billing tools. Excel-native FP&A platforms promise to connect these sources, but user experiences suggest the reality is messier.
Cube’s NetSuite integration problems appear repeatedly in reviews. One user described an ongoing struggle: “We could never get an automatic data connection with NetSuite working, so it is always a manual upload process each month.”
Another highlighted how integration failures compound during critical periods: “Unfortunately, we have had ongoing issues over the past few months with syncing our Cube to Netsuite. As everyone knows in FP&A the monthly close is always a time crunch... We have had ongoing issues with syncing Netsuite to Cube which has greatly delayed the turnaround time to generate standard reporting.”
Datarails users encounter different friction points. The add-in performance degrades with complexity: “Our primary issue with Datarails is the cumbersome nature of its Excel Add-In feature. While it functions well, Excel workbooks that contain multiple tabs and Datarails references tend to take a long time to load and refresh.”
Data consistency across sources creates additional headaches, with users reporting that working with multiple data sources requires extra effort to correct and align different data sets.
Collaboration workflows also hit limits. Cube doesn’t support simultaneous data loading; two teammates can’t load at the same time, forcing delays that compound as teams grow.
As Datarails users reiterate in their reviews, the platform siloes workspaces in ways that limit cross-team visibility: “The separation between workspaces made it difficult to collaborate across teams or share insights seamlessly. This often resulted in duplicated efforts.”
Enterprise scalability and governance limitations
As organizations grow beyond mid-market size, requirements shift. Audit trails, access controls, complex scenario modeling, and board-level reporting become non-negotiable. Both platforms show strain at this threshold.
Cube users at larger organizations report missing capabilities that matter at scale: “Missing certain features like a headcount planning module or robust forecasting capabilities in order to be an effective end-to-end FP&A platform for larger companies at scale.”
The performance issues intensify during high-stakes periods: “We suffer every Close and Quarter-End Process because of the delay it takes in importing data and subsequently refreshing that data to flow through our system... something that you would think can be resolved in 1-2 hours ends up taking 24hrs+.”
Datarails struggles with complex financial structures. One user was blunt about the mismatch: “Our company is quite complex and several times our issues were handled between both customer support as well as the integration team.”
The reporting and governance capabilities also fall short of enterprise expectations. Datarails users note that dashboard formatting isn’t intuitive and custom formulas require tedious workarounds: “The report builder formats and layouts are a bit basic... You can’t calculate at different levels that roll up into each other, which means you have to adjust the formula each time another account code gets added.”
Both platforms struggle to address evolving needs, such as AI-assisted financial storytelling, truly “finance-owned” platforms with minimal IT dependency, and narrative-driven outputs to replace old tabular reporting.
Excel-native architecture makes these capabilities harder to deliver. When your foundation is a spreadsheet add-in, there’s only so far you can push automation, visualization, real-time collaboration, and intelligent assistance.
How Drivetrain outperforms Cube and Datarails
The limitations outlined above are architectural. Excel-native platforms can optimize around spreadsheets, but they can’t escape them.
Drivetrain takes a different approach: it is a purpose-built, cloud-native platform designed from the ground up for the FP&A requirements of mid-market businesses and enterprises.
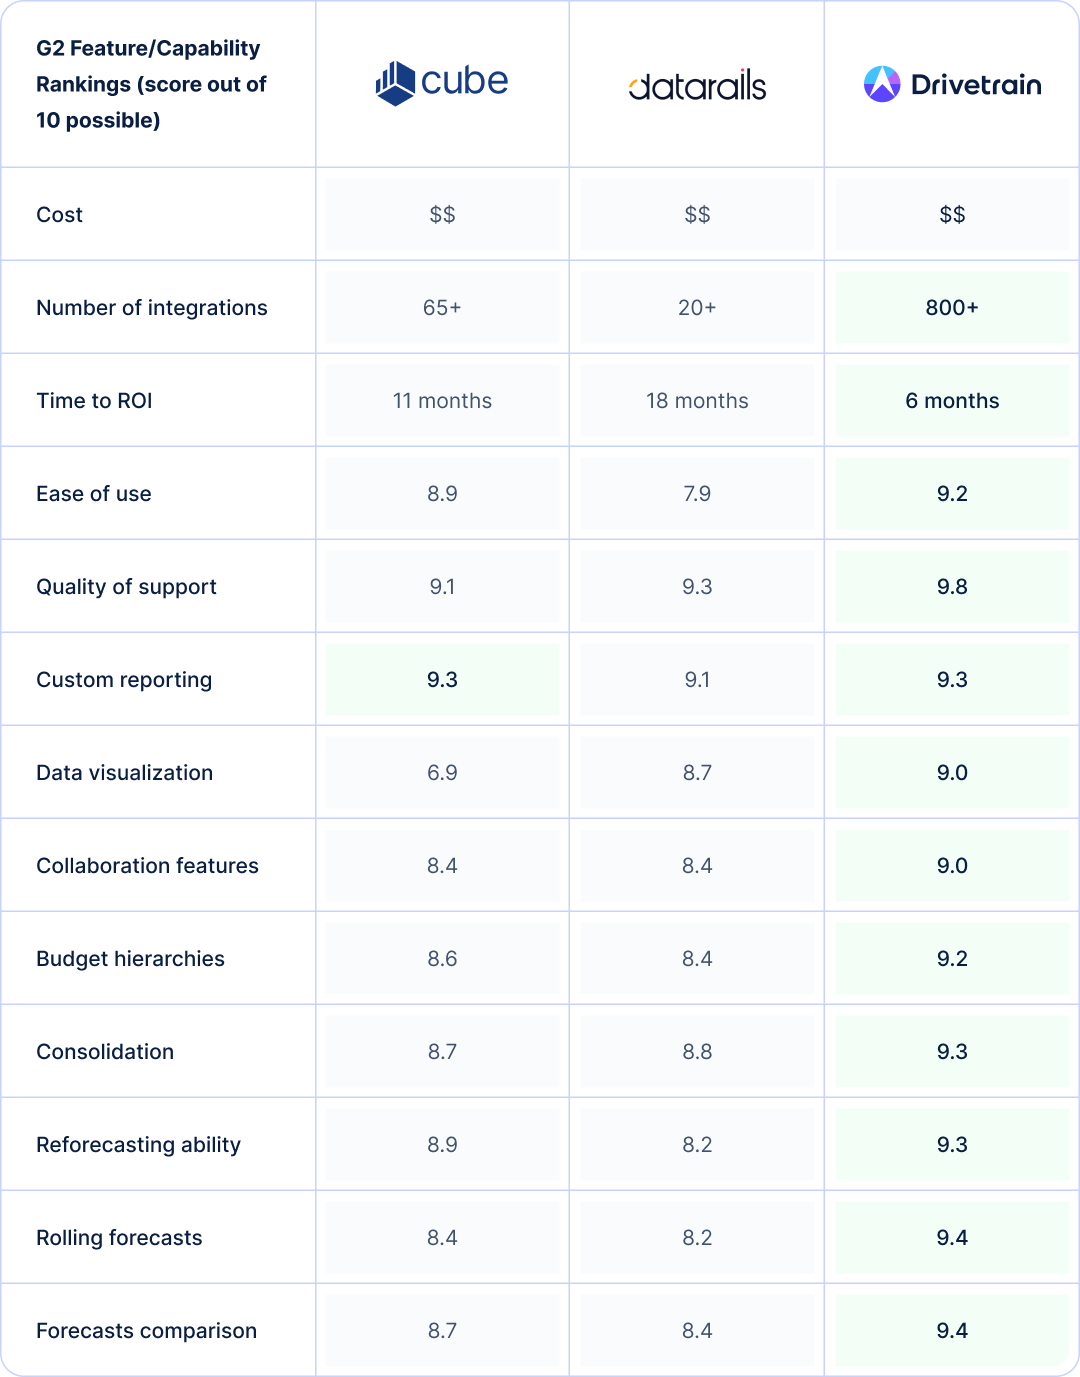
The user reviews data tell a clear story. Drivetrain outperforms both Cube and Datarails across virtually every capability metric while delivering ROI in roughly half the time.
An AI-native platform
Unlike Cube and Datarails, Drivetrain is an AI-native FP&A platform, meaning its AI capabilities are built into the platform’s core workflows to offer finance teams tangible value in terms of time saved, accuracy, and insights.
With Drive AI , users can replace time-consuming data operations with plain-English prompts that transform their data in seconds for use in models.
Automated anomaly detection leverages machine learning to continuously monitor incoming and existing data in the platform. If any values are outside of the user’s predefined limits, they will be instantly notified via email and Slack.
This is AI that gives finance teams real confidence that the data they’re using in models and reports is always up to date and accurate.
Surfacing data-driven insights is also easy. Just ask the question in a prompt and Drive AI will answer it in seconds.
Cloud-native architecture enables true workflow automation
Drivetrain is cloud-native. There’s no Excel add-in sitting between your finance team and the platform. This matters because it eliminates the performance bottlenecks, compatibility issues, and collaboration constraints that plague spreadsheet-dependent tools.
Users describe the shift in practical terms. This user made a telling observation: “This is the first platform I’ve used where I’ve felt comfortable getting rid of the ‘backup’ excel model.”
That’s a meaningful threshold. When finance teams don’t fully trust their FP&A platform, they maintain “shadow” spreadsheets on the side, which adds back much of the time their spreadsheet-native solution was supposed to save.
Drivetrain’s Excel-inspired UI builds trust instantly without inheriting spreadsheet limitations. Users get a familiar mental model for building reports and models, but the underlying engine handles automation, versioning, and collaboration natively.
The G2 ease-of-use score reflects this. Drivetrain rates highest among the three platforms, despite being the most capable. That combination rarely happens with enterprise software.
The ROI timeline compresses dramatically as a result. Where Cube and Datarails measure time-to-value over nearly a year or more, Drivetrain users report achieving payback in roughly half that time.
Unified data ecosystem with enterprise-grade integrations
When your FP&A platform connects to more systems, you spend less time on manual data manipulation and more time on actual analysis. Drivetrain offers more than 800 native integrations—an order of magnitude more native integrations than either Cube or Datarails.
Users confirm the practical impact. One team connected QuickBooks, Zoho, Databricks, Salesforce, and BambooHR, describing the integration process as “easy and seamless.”
Another emphasized the consolidation value: “We wanted to move away from having endless Google sheets and having all our important business data in one place—Drivetrain helped us achieve that in an efficient and quick way.”
The difference becomes clear during implementation. Where Cube users report ongoing NetSuite sync failures, and Datarails users struggle with data source consistency, Drivetrain users describe connections that are “a few clicks away from ingesting the data.”
Models actualize with accounting data at the push of a button rather than manually uploading data for systems that can’t integrate and reconciling discrepancies. The G2 scores for consolidation and collaboration both reflect this. Drivetrain leads in each category.
Scalable governance with advanced modeling capabilities
As organizations grow, FP&A requirements shift from “can we build a budget” to “can we model complex scenarios, control access appropriately, and produce board-ready outputs without manual formatting.” Drivetrain is built for businesses on this trajectory.
The modeling depth stands out in user feedback. One finance leader described the capability: “We can model at a very granular level (vendor, department, etc.) without much effort and create digestible reporting outputs.”
Another put it more simply: “If you can think it, you can build it.” This flexibility matters for growing companies whose planning needs evolve faster than their tools typically accommodate.
Governance features scale accordingly. Users note that “creating different access levels is a breeze,” a stark contrast to the permission limitations and siloed workspaces that constrain Cube and Datarails at scale.
The platform removes what one user called the “black box” challenges that older platforms have, providing visibility into how models work rather than hiding logic in spreadsheet cells.
The reporting layer delivers executive-ready outputs without the formatting burden Excel-native tools require. Users describe dashboards that “wow investors” and visualizations that are “leagues above the other tools we researched.”
For finance teams spending hours making spreadsheet exports presentable, that’s time returned to actual analysis.
The G2 data validates these claims across the board. Drivetrain scores highest on data visualization, budget hierarchies, rolling forecasts, and scenario comparison, the exact capabilities that matter as organizations scale beyond mid-market complexity.
Making the right choice for your finance team
Choosing FP&A software is more than a feature comparison exercise. One needs to seriously consider where your finance function is headed and what infrastructure will support that trajectory.
The wrong choice creates technical debt that compounds as your organization grows, not to mention the utter waste of valuable dollars.
1. Start with an honest assessment of your current Excel dependency
How much of your finance team’s institutional knowledge lives in spreadsheets?
If your planning processes are deeply embedded in Excel models that took years to build, a spreadsheet-native tool might offer a gentler transition.
2. Understand the tradeoffs you may have to make
Are you optimizing the status quo or enabling true transformation?
If your team is already frustrated with spreadsheet limitations—version control chaos, broken formulas, and endless collaboration bottlenecks—an Excel-native platform may just formalize those frustrations rather than resolve them.
3. Consider your technical environment and team composition
What operating systems does your team use? Are you standardized on Windows desktop Excel, or do you have Mac users, remote workers on browser-based tools, or teams that prefer Google Sheets?
Platform compatibility issues surface after purchase, not before. If your environment is mixed, solutions that depend heavily on Excel add-ins will create friction for part of your team.
4. Evaluate your integration requirements honestly
List every system that feeds your financial planning: ERP, CRM, HRIS, billing platforms, and data warehouses. Then ask how often that data needs to refresh and how much manual manipulation currently sits between source systems and your planning models.
Platforms with limited native integrations push that work onto your team. The time savings you expect from FP&A software can evaporate if you’re still manually exporting and uploading data.
5. Think about your growth trajectory over the next three to five years
A platform that fits a 20-person company with straightforward financials may not fit a 200-person company with multiple entities, complex allocations, and board-level governance requirements.
Migrating FP&A platforms is painful as you’re not just moving software; you’re fundamentally rebuilding models and retraining teams. Choose a platform that can take you where you’re going, not just serve you where you are.
6. Ask hard questions about time-to-value expectations
Some platforms implement quickly but take a year or more to deliver measurable ROI. Others require longer setup but compress the payback timeline.
Neither approach is inherently better, but the mismatch between your expectations and the platform’s reality creates frustration. Let’s say your CFO needs quick wins to justify the investment; a platform with an 18-month ROI timeline is the wrong fit regardless of its features.
7. Finally, pressure-test the AI and automation claims
Every FP&A vendor markets AI capabilities now. Few deliver automation that meaningfully reduces finance workload.
Ask for specific examples of what the AI actually does. Talk to current customers about whether the automation features they were sold match the automation features they use.
Choosing your FP&A partner
Cube and Datarails both solve real problems for specific types of organizations. Cube makes sense for small finance teams deeply embedded in Excel who need centralized collaboration without abandoning their spreadsheet workflows.
If your primary pain is version control chaos and you’re comfortable with a gradual ROI timeline, Cube offers a lighter-weight path forward.
Datarails fits organizations that need structured workflows for multi-stakeholder budgeting and want executives accessing dashboards while finance works in Excel, provided you’re running a Windows-dominant environment and have patience for a steep learning curve.
But both platforms share a fundamental constraint: they’re built around Excel, which means they inherit Excel’s limitations: performance bottlenecks during close, collaboration friction at scale, and integration workarounds that never fully disappear.
For finance teams that need to operate beyond spreadsheet boundaries, Excel-native architecture becomes the ceiling.
Drivetrain’s cloud-native architecture delivers faster ROI, broader integrations, enterprise-grade governance, and the modeling depth that scaling organizations require—without forcing your team through a painful learning curve.
The G2 data confirms what users report: higher scores across ease of use, visualization, collaboration, consolidation, and forecasting capabilities, all with unparalleled support. With Drivetrain, you get ongoing support with a dedicated customer success manager and access to experts in finance from day one.
If your finance function is ready to stop optimizing spreadsheets and start building a strong FP&A infrastructure that will support unlimited growth, book a demo with Drivetrain today.

Mona Sharma is a Senior Finance Manager and Chartered Accountant with over seven years of experience across controllership, MIS reporting, statutory audit, and startup finance. She spent over three years at Deloitte working on diagnostic reviews, IFC engagements, and risk control matrices. At BeepKart, she managed the full finance function, including Series A due diligence, FDI restructuring, debt fundraising, and monthly close processes. At Drivetrain, Mona writes about controller best practices, financial close processes, compliance and audit workflows, and how finance teams can build scalable accounting operations.
FAQs
Do Cube and Datarails actually replace Excel or just work alongside it?
Neither platform replaces Excel; they “extend” it. Both route core planning, modeling, and data entry workflows through Excel add-ins. You’re still building in spreadsheets; you just have cloud connectivity and version control layered on top. Users describe this as Excel with guardrails rather than a fundamentally different way of working.
The comfort of familiarity comes with a tradeoff: you inherit spreadsheet limitations around performance, collaboration, and automation depth. Teams often find themselves maintaining the same manual habits inside a new tool.
What’s driving finance teams to look beyond Excel-native solutions?
The shift from Excel-native platforms is the result of several convergent factors. Finance leaders want true workflow automation that doesn’t break during month-end close. They need real-time collaboration without the “no simultaneous loading” constraints that spreadsheet-native tools impose.
Governance requirements are tightening—audit trails, role-based access, and compliance controls that spreadsheet-based solutions struggle to deliver. And there’s growing demand for AI that actually reduces workload rather than just adding a chatbot on top of existing processes.
User reviews reveal a clear pattern: teams that adopted Excel-native tools are now hitting ceilings in terms of scalability and automation because they inherit the same limitations inherent in spreadsheets.
What are the most common integration problems with Cube vs. Datarails?
ERP connectivity issues dominate the complaints. Cube users report persistent NetSuite sync failures that force manual uploads each month.
Datarails users struggle with data consistency across multiple sources, particularly around signage conventions and mapping complexity. Both platforms face performance degradation when workbooks grow large or queries get complex.
The add-in architecture creates a bottleneck: data has to flow through Excel, which limits how seamlessly these tools can connect to modern data stacks. Teams with customized ERP configurations or multi-system environments feel this friction most acutely.
How do the AI features compare in practice versus marketing claims?
There’s a gap between the marketing and reality. Both platforms promote AI capabilities, but user feedback suggests the automation remains surface-level.
Datarails offers “FP&A Genius” for natural language queries; Cube has begun adding AI-assisted features. Neither delivers the deep automation that would meaningfully transform how finance teams operate.
User reviews highlight skepticism among finance leaders about whether “AI-powered” claims translate to practical value. For teams prioritizing genuine AI capabilities—predictive insights, automated variance commentary, intelligent scenario generation—purpose-built cloud platforms currently outpace Excel-native solutions.
How do Datarails’ native dashboards compare to a BI tool?
Datarails’ built-in dashboards eliminate BI tool dependency, which works well for teams without dedicated BI resources. However, users describe the visualizations as basic with limitations on customization and cross-system data blending.
The platform handles straightforward financial reporting but struggles with sophisticated storytelling.
We’d advise piloting an actual board pack creation during evaluation to test whether drill-down paths, formatting options, and visualization capabilities meet your needs.
How do the AI features of Cube vs. Datarails compare in practice versus marketing claims?
There’s a gap between the marketing and reality. Both platforms promote AI capabilities, but user feedback suggests the automation remains surface-level.
Datarails offers “FP&A Genius” for natural language queries; Cube has begun adding AI-assisted features. Neither delivers the deep automation that would meaningfully transform how finance teams operate.
User reviews highlight skepticism among finance leaders about whether “AI-powered” claims translate to practical value. For teams prioritizing genuine AI capabilities—predictive insights, automated variance commentary, intelligent scenario generation—purpose-built cloud platforms currently outpace Excel-native solutions.
How do Cube and Datarails handle Mac and Google Sheets environments?
Buyers frequently flag limitations in mixed IT environments for spreadsheet‑native stacks. Validate device/OS support, add‑in performance, and any compromises for Mac or Google Sheets users in your organization before committing.


.webp)