.svg)
.png)
In this guide, you’ll learn about:
- The three main metrics that shape revenue growth in professional services firms: billable hours, utilization, and capacity.
- What each metric measures, how they differ, and why treating them as interchangeable metrics leads to misinformed decisions around hiring, pricing, and planning.
- How to use these metrics together to model your firm’s revenue ceiling and identify whether your real constraint to business growth is demand (pipeline) or delivery (capacity).
Your sales team is courting a client with an opportunity worth $300K. Your delivery team is at 95% utilization. If you close the deal, will you be able to deliver?
Looking at your utilization rate, you might think, “We have plenty of headroom,” especially if it’s less than 100%. Or maybe you have too many people sitting on the bench (i.e., billable hours going unused), and you want to get them busy.
Making a decision based solely on billable utilization or billable hours can be a big mistake. Neither provides a complete picture, and most importantly, neither will tell you whether your firm actually has the capacity to support new work.
Billable utilization, billable hours, and capacity are inherently related. But treating them as interchangeable is one of the most common and costly planning mistakes in professional services.
This article will define and discuss each of these metrics in detail, explaining how they interact and illustrating how to use all three to make smarter decisions around business growth, revenue planning, project pricing, and hiring.
What are billable hours?
Definition: In professional services, billable hours are the actual hours employees spend on work that can be billed to specific clients.
Billable hours are a measurement of time spent on tasks such as client meetings, project-specific research, design, and creation of tangible deliverables—work that directly serves the client. Conversely, non-billable hours include internal meetings, training, admin, and business development.
Billable hours are the result of upstream decisions: how much capacity you have and how effectively you deploy it.
Why billable hours vs. utilization tell very different stories
Billable hours can feel like a reliable measure of performance because they’re trackable. But they don’t tell the whole story, or more specifically, how much revenue you may have left on the table. This is the other half of the story, and you can read it in your firm’s utilization rate.
Consider this scenario: The delivery team reported 10,000 billable hours in the last quarter. This looks great on the dashboard, but the problem is that the firm had the capacity for 15,000 hours. So its billable utilization—the percentage of the firm’s total available billable time that could actually be invoiced—was only 67%.
With a $100 per hour blended rate, that means the firm left $500K (33% of its capacity) on the table. This is a simplistic example that assumes the demand exists for the $500K, all the firm’s capacity is sellable, and there’s no utilization friction. However, it makes it easy to see how billable hours can mask a utilization problem—one that can significantly impact revenue growth and long-term profitability.
The trap is treating billable hours as a standalone metric, as if billable hours, capacity, and utilization exist independently. They don't. Billable hours are a result of capacity and utilization decisions that were made weeks or months in advance.
Why it’s still important to track billable hours
Despite the limitations we’ve discussed here, billable hours provide important signals in the right context:
- Invoicing and project profitability: This helps in understanding the revenue attached to actual work delivered. It also helps to analyze historical performance—how much work did specific teams, clients, or projects generate?
- Implementation and onboarding: The set-up, customization, and training work that comes before the project kickoff is often invisible in project summaries. Tracking it ensures it's either billed directly or properly accounted for in overall project costs.
- Scope creep: It is important to track and document hours when a client requests changes outside the original agreement to justify additional fees or renegotiate the scope.
- Project-based pricing: Even for firms that don’t use hourly billing, tracking hours is useful for comparing actual effort against estimates to more accurately estimate costs for future projects and price them accordingly.
- Client communications: Tracking time spent on communication with the client in meetings, emails, and follow-ups helps to ensure that it’s either billed or at least visible to the client and internally, when assessing the true project cost.
What is the billable utilization rate?
Definition: Billable utilization—also known as billability or billable utilization rate—measures the percentage of an employee’s total available working hours spent on “billable” client work.
Billable utilization is more than a time-tracking metric; it is a direct measure of how effectively a firm converts its capacity into revenue, or more specifically, how capacity is allocated to billable work.
Billable utilization should be calculated only on “billable-capable” employees—employees that contribute directly to billable client work, since billable hours figure as the numerator in the formula (given below).
These include account managers, strategists, creatives, developers, and consultants. Including non-billable employees, like administrative assistants, finance, HR, operations, IT, and office staff, in the denominator will artificially lower utilization and make delivery teams look inefficient when the issue is actually cost structure, not capacity.
Let's see how. Employee X works 160 hours/month (40 hours/week × 4 weeks) and logs 120 billable hours.

What “available hours” really means
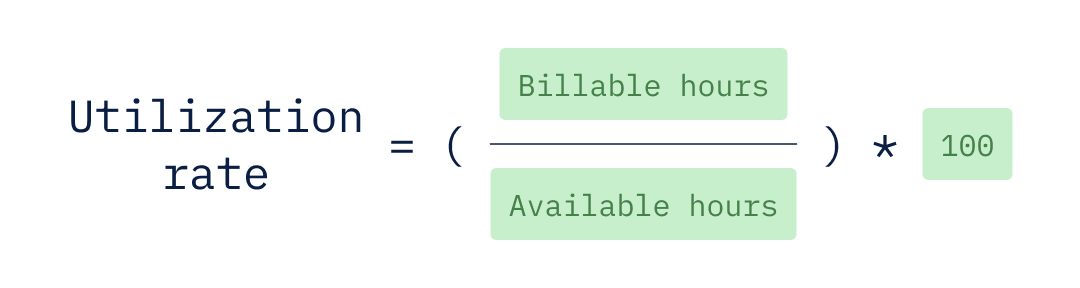
The utilization formula is simple, but it only works if “available hours” is clearly defined in terms of what it means and how it’s calculated.
Available hours can mean different things depending on how your firm plans capacity and reports performance. This means the same billable work can produce very different utilization rates and very different management decisions.
Let’s say two firms or two teams in the same firm do the exact same amount of billable work, but report different utilization rates. This is because they define “available hours” differently.
In a single month, the consultant had:
- Billable hours: 120
- Paid hours: 160
- Holidays: 8
- PTO: 8
Now, let’s calculate the same consultant's utilization rate based on the different definitions of available hours:
Paid hours baseline: 120 ÷ 160 = 75% utilization
Working hours (minus holidays): 120 ÷ 152 = 79% utilization
Net available hours (minus holidays + PTO): 120 ÷ 144 = 83% utilization
Clearly, how a firm defines available hours can impact its utilization rates:
- At 75%, the leadership thinks, “We have a utilization problem. Let’s push employees harder to keep them gainfully occupied and achieve targets.”
- At 83%, the leadership thinks, “We’re near capacity. Let’s not sell more work until we hire.”
While nothing has changed in terms of the actual work done, the math makes all the difference, impacting business decisions around revenue and hiring.
Rule of thumb: Use paid hours for consistency in trend reporting and net available hours when forecasting or making hire vs. sales decisions.
Using utilization rates at different levels in your organization
The utilization rate formula can also be used to calculate utilization at different levels, depending on the question you need to answer.
The utilization trap: when high utilization masks low capacity
Utilization rate is one of the most important professional services metrics and appears near the top of almost every board-level KPI dashboard. The reason for this is that in a company where people are the primary cost and the primary product, utilization is the most direct link between delivery capacity and revenue performance.
At the same time, treating utilization as the primary measure of success can create a real operational blind spot. This is because utilization measures whether capacity is being converted into billable work, not whether that work is actually converted into revenue.
Let’s look at the following example.
Agency A is running at 95% utilization with 10 billable employees with a blended hourly rate of $150. So, this is clearly a high-performing delivery team.
The sales team is high performing, too, and has an opportunity that will require 300 hours of work per month. Based on utilization rate alone, the firm might try to close the deal.
However, the delivery team can only absorb 80 hours. That’s all that is currently remaining of the 1600 total available hours. It’s only by evaluating the opportunity within the context of capacity that this becomes evident.
This is an example of how utilization rates can mask low capacity. In this case, the firm must make the difficult choice of whether to turn down a $45,000/month opportunity because it can't fulfill the scope, or overcommit and risk delivery quality on both existing and new work.
What is a good billable utilization rate?
According to the SPI Professional Services Maturity Benchmark Report for 2025, the average billable utilization rate for high-performing firms (the top 20% of the more than 500 firms surveyed) is 75%, while the average among the rest of the firms surveyed was 64.9%.
The report also breaks utilization down by firm size, defined by the number of employees:
There's a reason high-performing firms don't aim for 100% utilization. They know that utilization leads to diminishing returns once it exceeds what is realistic for their business and risks:
- Cannibalization of non-billable time: Internal training, knowledge transfer, proposal work, and the back-office work that supports projects can suffer, eroding future capacity even if current billable hours look healthy.
- More errors and rework: Pushing for unrealistically high utilization leads to overutilization, with people working long hours often without sufficient breaks. Every billable hour spent reworking deliverables and correcting mistakes instead of new project work eats away at project margins.
- Higher attrition: When overutilization is ongoing, the inevitable burnout accelerates attrition. Losing billable staff has both short- and long-term negative effects on a firm. When employees leave, the firm loses those employees’ client relationships, project context, and the institutional knowledge that often has taken years to build.
When firms push utilization higher than is realistic, these pressures build beneath the surface, quietly hollowing out your firm’s capacity. Ultimately, they show up in the numbers as write-downs, scope overruns, and poor realization rates. But, you won’t see them right away, at least not in your utilization rate.
This is because the utilization rate is a “rearview” ratio. It tells you what percentage of available capacity was billed in a past period, but won’t capture the capacity losses until after they’ve already impacted your firm. So, your utilization rate will look strong right up until it doesn’t.
Whatever utilization rate you target, remember…
Utilization rates are only meaningful in the context of capacity.
What is capacity in professional services planning?
Definition: Capacity—also known as delivery capacity or available hours—is the maximum amount of client work a firm can realistically deliver with the people and time it has available.
Capacity is the real constraint. It’s the limiting factor that gives utilization its meaning. While utilization can tell you what percentage of capacity you’re converting into billable work, it’s your firm’s capacity that defines its maximum possible output.
In professional services, delivery capacity is time-based, that is, available hours in your billable utilization formula, and that time limits how much work, and ultimately, revenue you can deliver. So, it’s a critical professional services metric that leaders need to make sound decisions regarding project planning and workforce management.
The two layers of capacity
Theoretical capacity and practical capacity are used to measure how efficiently human resources are used in business. Theoretical capacity represents the “perfect world” maximum, while practical capacity is the realistic maximum.
- Theoretical capacity = contracted hours (e.g., 2,080 hours/year) minus time-off (PTO and holidays). This is what most firms start with.
- Practical capacity = theoretical capacity minus non-billable, but necessary time spent on activities such as management, enablement, internal ops, pre-sales and support, and a buffer for QA/rework.
The gap between theoretical and practical capacity is why utilization targets should never be set at 100% capacity. Targeting a lower utilization rate isn’t a sign of inefficiency. Rather, it acknowledges the fact that in professional services, a sustainable business needs room to breathe—to develop its people and invest in future work while still delivering on current projects.
How to calculate practical capacity for professional services planning
Start with determining how many hours one FTE can actually allocate to work in a given year (annual capacity per employee). Below is a simple formula for calculating theoretical capacity followed by a worked example:

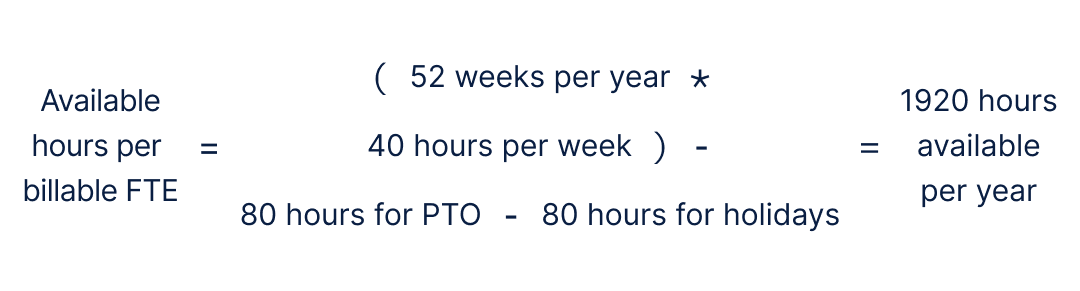
Once you have defined the capacity per billable FTE, you can calculate the capacity for your firm:

Some important nuances
Most firms deduct only predictable, planned time off when calculating available hours per FTE:
- Unplanned sick time is typically absorbed through conservative utilization targets because sick time is unpredictable, averages out at the firm level over time, and tracking it explicitly adds complexity without much planning value.
- Bench time is intentionally left in the utilization metric rather than being deducted upfront. Bench time is the gap between available hours and billable hours. Utilization is designed to surface bench time, not mask underutilization.
- Billable FTE does not imply 100% billable utilization; it refers to employees whose primary role is to deliver client work and who are expected to generate billable hours.
How billable hours vs. utilization define your revenue ceiling
Capacity and utilization define the outer boundary of your revenue potential, that is, what your business can actually deliver, not just sell.
Fundamentally, professional services revenue is governed by three variables:
- Time (capacity): How many available hours your team has to work
- Conversion efficiency (utilization): How much of that time is spent on billable work
- Price (billable rate): How much you earn per billable hour
Together, they explain why billable hours rise, plateau, or stall, even when demand is strong.
Tracking utilization without capacity is misleading. Capacity determines how much work is possible. Utilization determines how much of that capacity is monetized (billable work).
A healthy utilization rate can mask a hard revenue limit if capacity is constrained due to headcount issues, skill gaps, or scheduling inefficiencies, for example. Conversely, low utilization may signal excess capacity rather than weak performance.
Finance leaders need to consider utilization as a capacity allocation signal, instead of an optimization target. The idea is not to maximize utilization in isolation but to align it with demand, hiring plans, and margin targets.
Translating capacity and utilization into a revenue ceiling
Once you have determined your firm’s available capacity, you can combine it with your billable utilization rate to determine your baseline revenue ceiling, which is the maximum revenue your business can realistically expect to earn based on your current operating model.
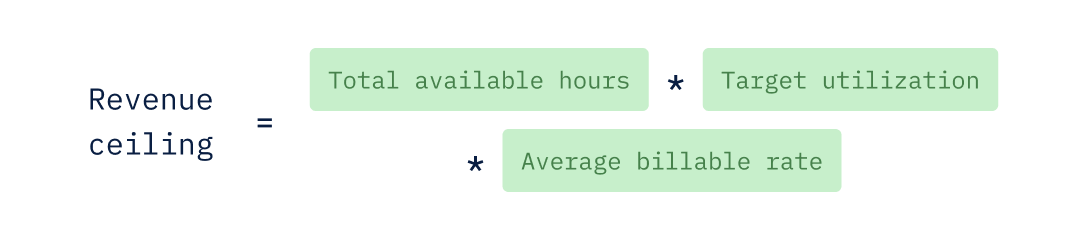
The equation below describes the theoretical revenue ceiling based on three primary levers: time (capacity), conversion of time into billable work (utilization), and value per hour (average billable rate).
Note that if your firm routinely discounts work or experiences write-downs, realized revenue will be lower than this ceiling. Realization acts as a downstream adjustment to revenue, not a constraint on delivery capacity.
Let’s consider the following example:
- Agency C theoretically has 96,000 total available hours/year.
- With a 75% target utilization, it might realistically expect 72,000 billable hours/year.
- Its average billable rate is $150/hour.

This number is extremely useful for setting targets. It allows you to run what-if scenarios and evaluate which levers, i.e., pricing, hiring, utilization rate improvement, etc., will actually drive revenue growth. The number also enables you to run “what-if” scenarios before committing to decisions, such as:
- What happens if you improve utilization from 75% to 78%? That’s almost $432K in additional revenue (without adding a single person).
- If you hire more FTEs, does the revenue ceiling increase enough to justify the cost?
- What if you raise your average billable rate by $10/hour? How much does the ceiling shift?
While this is a straightforward calculation, the value lies in the interpretation.
This number (i.e., the revenue ceiling) is not the absolute target; it’s a constraint that requires understanding. It defines the outer limits of what your current operating model can support.
Finance leaders who understand this distinction will spend less time chasing unsustainable targets and more time understanding what actually limits growth.
Why capacity (not pipeline) is the primary constraint
Most professional services firms assume growth is constrained by the pipeline. Once revenue is capped by capacity and utilization, additional pipeline doesn’t increase output—it increases strain. In reality, the constraint is almost always delivery capacity. For example, you can have $20M in pipeline, but if you only have capacity for $10M, you either:
- Turn away profitable work, or
- Overload your team (driving utilization to over 95%, causing burnout)
Pipeline represents potential demand. Capacity determines actual supply. Most professional services firms optimize for pipeline (sales) when they’re actually constrained by delivery capacity, resulting in a negative feedback loop.
Sales closes deals → Delivery can’t staff them → Utilization spikes → Quality drops → Churn increases → Sales has to close even more deals to hit targets
How to decide whether to invest in is sales or delivery capacity
When you find your firm in that negative feedback loop, you need to determine if the problem is delivery capacity and investing accordingly:
- If pipeline < capacity → invest in sales
- If pipeline > capacity → invest in delivery
Many businesses default to investing in sales because the pipeline is more visible than capacity. This is the core challenge of capacity planning in professional services—the real constraint (i.e., capacity) is rarely visible until it's already impacting delivery.
Firms that proactively factor both capacity and pipeline together into their revenue forecasting and planning find it easier to make confident business decisions.
How to expand and unlock capacity for your business
There are three ways to increase your firm’s ability to deliver more work:
- Hire more people: Adding more billable FTEs directly increases your available hours and raises your revenue ceiling. While it is reliable and works out in the long term, it has the highest fixed cost (compensation and other benefits) and also the longest lead time (recruiting, hiring, and onboarding).
- Increase utilization by optimizing hours: This can be done by reducing bench time (underutilized resources) through more efficient scheduling and pipeline visibility. This not only ensures that fewer hours are spent on the mismatched projects (skill levels of employees vs. complexity in the work involved), but also increases realized utilization without adding headcount.
- Leverage contractors/partners: This could be the most strategic lever for your business. Contractors and vendors help manage spikes in demand without adding to your fixed headcount costs and operating expenses.
How billable hours vs. utilization shape capacity decisions
Understanding the differences between and the nuances of billable hours, billable utilization, and capacity help finance leaders:
Balance hiring vs. selling tradeoffs
When the utilization rate is consistently above 80%, and the pipeline is strong, delivery teams don’t need to push harder.
Instead, the management needs to hire more FTEs.
No amount of efficient scheduling or capacity optimization can replace the impact of additional headcount on your revenue ceiling.
Avoid burnout-driven growth ceilings
While pushing utilization to near capacity generates revenue in the short term, it leads to productivity loss and slower business in the long term.
In addition, replacement hiring to counter attrition always costs more than the actual compensation for the role.
Make utilization a signal, not a goal
As discussed earlier, utilization is not simply a time-tracking metric or an indicator of success.
Businesses need to consider billable utilization as a leading indicator of how much delivery capacity is available for billable work.
CFOs should use it as a signal to track if demand is outpacing supply, if work is being distributed inefficiently and unevenly, or if there is a pipeline vs. headcount gap.
Revenue planning software and scenario analysis tools can help connect capacity, utilization, and financial outcomes. However, given the inherent complexity of professional services businesses, looking at the broader technology landscape is useful.
The missing piece in the professional services tech stack
There’s a whole lot of software on the market today to help professional services firms manage their business. Most mid-market teams already run with a fairly robust tech stack, including a CRM system to track the demand signal, an HRIS to manage headcount, hiring, and people costs, and project management, time tracking, billing, and accounting tools to capture project delivery and financial transactions.
As firms scale, many also adopt a professional services automation (PSA) tool, which can help tame a lot of the operational chaos by connecting resource allocation, time tracking, and utilization to make capacity planning easier. However, the truth is...
None of these technologies provide finance leaders in professional services firms with what they need to effectively grow the business.
To do that, you need a modern financial planning and analysis (FP&A) software that combines operational data and financial data into a single platform for connected, multi-dimensional modeling and robust scenario analysis.
With a purpose-built FP&A platform like Drivetrain, finance teams can go beyond reporting the impacts of capacity decisions already made to answering strategic planning questions, such as:
- Develop a 12-month, capacity-constrained forecast for revenue, gross margin, operating profit, and cash flow across multiple pipeline scenarios.
- Validate growth targets against real constraints by showing whether the plan is achievable given hiring lead times and utilization ramp.
- Translate the plan into timing commitments by modeling when new hires become billable and quantifying the delivery and revenue impact of delays.
- Quantify the economics of hiring employees vs. contractors based on fully loaded cost, expected realization, and contribution margin per billable hour.
- Optimize capacity to maximize profit by showing where incremental hires create the highest return across service lines and role mix, including opportunity cost.
- Stress-test pricing and delivery assumptions by modeling the company-level impact of rate changes, utilization targets, and delivery mix on revenue, margin, and cash collection timing.
FP&A software is the missing link that enables professional services firms to create more agile, strategic plans. It sits on top of your existing tech stack and connects the systems you already use into a unified planning layer where you can build a robust, scenario-driven financial model that stays current as conditions change.
That means you can model growth tradeoffs with real constraints faster, quantify the financial impact of capacity decisions before you make them, and adjust assumptions without starting over.
Learn more about how Drivetrain can help your professional services firm connect billable hours, utilization, and capacity within a single, powerful model for better revenue planning and forecasting.
Frequently asked questions
Billable hours are an absolute number—the total hours billed to clients in a period. Utilization is a rate, that is, billable hours as a percentage of available hours. Both measure client work, but utilization is far more useful for benchmarking and planning because it accounts for the size of your team and the time available.
There are three categories of available hours:
- Paid hours, that is, total hours in the period
- Working hours, that is, paid hours minus company holidays
- Net available hours, that is, working hours minus PTO and planned non-billable time
Each category not only provides a different utilization rate from the same billable output, but also different signals for decision-making.
Start with contracted hours, then subtract actual company holidays and expected PTO. Since sick time is unpredictable and typically averages out across the firm over time, it should not be subtracted upfront. Bench time should remain within the utilization metric instead of being deducted from capacity; doing so masks underutilization rather than surfacing it. Lastly, since different roles have different non-billable obligations, it is crucial to build your capacity model at the role level and then take it up to the team and firm levels.
Use billable hours for backward-looking analysis (e.g., invoicing, project profitability, and individual workload reviews). For forward-looking planning (e.g., headcount decisions, revenue forecasting, and capacity modeling), it’s better to rely on utilization and capacity calculations.
Use billable hours for backward-looking analysis (e.g., invoicing, project profitability, and individual workload reviews). For forward-looking planning (e.g., headcount decisions, revenue forecasting, and capacity modeling), it’s better to rely on utilization and capacity calculations.
Together, they define your revenue ceiling—the maximum your firm can earn at a given headcount, utilization rate, and billable rate. If you grow demand beyond that ceiling, you’ll either turn work away or overload your team. Raising the ceiling requires one of three levers: hiring more billable FTEs, improving effective utilization (i.e., reducing bench time and scheduling inefficiency), or flexing capacity with contractors and partners.


.webp)


