.svg)
.png)

A practical guide to the 8 board‑level professional services metrics finance leaders for service-based businesses should track: capacity, bench, billable utilization, realization rate, project gross margin, employee attrition, revenue per employee, and days sales outstanding (DSO).
People are the operating system in a professional services firm. They determine whether revenue is generated, captured, profitable, and collected. Revenue materializes only when the right people are assigned to billable work, deliver within scope, and their work gets converted into cash. Any breakdown in that chain, from unstaffed capacity to scope creep, write-downs, or slow collections, is missed revenue or eroded margins.
Finance leaders in professional services companies need the right metrics to tie revenue to capacity, utilization, and delivery when reporting to the board. Professional services metrics and KPIs measure how well your delivery engine converts demand into collectible revenue and flag risks early, helping prevent them from impacting your P&L.
In this article, we explain the top eight professional services metrics for board reporting and discuss how automating them creates decision-ready insights.
Top 8 professional services KPIs and metrics your board expects to see
Board reporting in professional services is about proving your people are turning demand into profitable revenue that can be collected.
Each of the eight professional services KPIs and metrics we discuss here acts as an early warning before it becomes a board-level financial problem:
- Capacity is the baseline assumption behind every board-level metric.
- Bench reveals whether current capacity is idle or ahead of demand.
- Utilization indicates whether delivery capacity is being used for billable work.
- Realization exposes the gap between work delivered and revenue captured.
- Project gross margin indicates whether the delivery remained profitable and pricing held up.
- Employee attrition signals future capacity risk.
- Revenue per employee shows whether growth is being driven by operational efficiency or simply increasing headcount.
- Days Sales Outstanding (DSO) flags friction in billing, acceptance, or collections.
Together, these professional services metrics and KPIs give finance leaders a complete view of performance and gaps. Now, let’s take a closer look at how.
1. Capacity
In professional services, capacity (aka delivery capacity or available hours) represents the maximum amount of client work a firm can realistically deliver with its available personnel and time.
While boards rarely ask for it in reports, capacity is a critical metric for professional services. Why? Because firms must measure and manage capacity accurately to calculate many of the professional services KPIs their boards do care about.
Without a clear baseline capacity, professional services KPIs such as utilization or revenue per employee can be misleading, potentially masking performance issues or delivery risks.
Formulas and examples
Note that in metric and KPI calculations, delivery capacity is expressed as “available hours,” but the two terms mean the same thing.
Calculating a firm’s capacity involves calculating the annual per-FTE capacity and multiplying it by the total number of FTEs.
Note that this calculation considers only billable FTEs—employees whose primary role is to deliver client work and who are expected to generate billable hours.
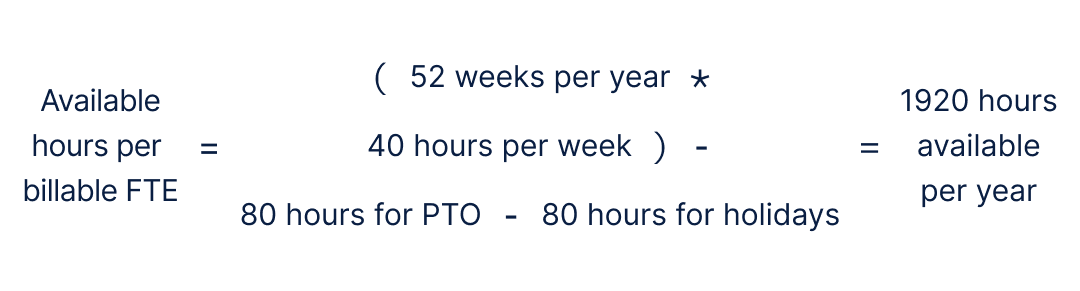
Start by calculating the available hours per billable FTE:

Here’s an example calculation of available hours per billable FTE:
Once you have defined the capacity per billable FTE, you just multiply that by the total number of billable FTEs you have to calculate the capacity for your firm:

Plugging the result from our previous example into this formula gives us a total capacity of 96,000 available hours per year:

2. Bench %
Bench is the number of available hours (delivery capacity) not assigned to revenue-generating or approved internal billable work.
Formulas and examples
Bench can be measured as average bench time in hours or as a percentage. Boards often care more about bench as a percentage of available hours than bench hours, as it is easier to assess revenue risk and staffing efficiency across periods.

You can refer back to the previous section for the capacity formula and an example calculation if needed for calculating your bench percentage.
Billable hours in the formula below represent the hours that an employee works on client projects and which can be billed. Some firms also treat work performed on internal projects that the company’s leaders consider valuable as billable, even if they can’t be charged to client projects directly.
Both billable hours and those charged to approved internal billable initiatives must be subtracted from available hours to calculate bench hours.

You have to calculate the bench hours first to calculate the bench as a percentage. But since boards often prefer to see the latter, let’s look at an example using the following data:
- Available hours = 4,000
- Billable hours = 3,400
- No approved internal billable initiatives
- Bench hours = 4,000 - 3,400 = 600

In this example, 15% bench means 15% of the firm’s entire delivery capacity sat idle during the period.
Why the board wants to know
Bench is usually interpreted as short-term wasted capacity. However, some part of that percentage may be planned. For example, some companies may hire before they actually need to, send people to training to build new skills, or prepare for a big project, which can make a temporary bench acceptable.
Boards want to know whether the bench is intentional and strategic, or whether it indicates weaker demand, pipeline gaps, or mismatched staffing.
What to watch
A rising bench percentage signals slowing demand, delayed projects, or over-hiring. A sharp drop looks good at first, but paired with high utilization, it warns of burnout and future attrition.
Evaluate bench alongside hiring and attrition data to distinguish how much of it is due to strategic investments vs. emerging revenue pressure.
3. Billable utilization rate
The billable utilization rate shows the percentage of working hours spent on paying client work. Utilization indicates whether demand and staffing are aligned. It answers the question, “How much of your billable workforce is actually making money?”
Formulas and examples
Utilization should be calculated only for billable full-time equivalents (FTEs), defined as employees whose primary role is delivering client work.
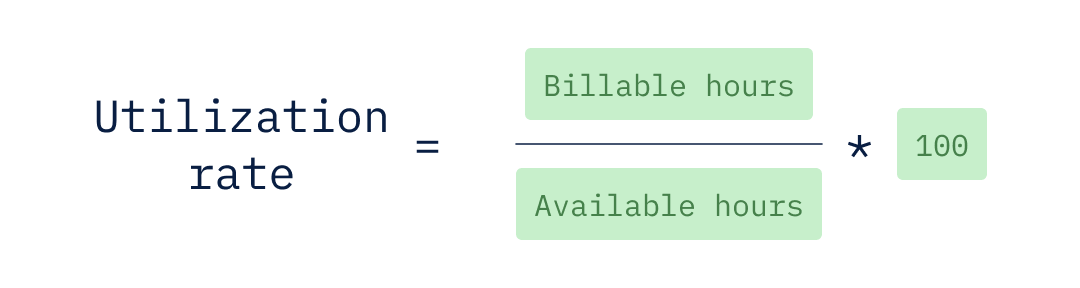
Since we’ve already discussed how to calculate billable hours and available hours, let’s look at an example of how to calculate annual utilization with those values provided:
- Billable hours invoiced for the year = 7,200
- Billable FTEs = 50
- Available billable hours per FTE per year = 1920
- Available billable hours per year for the agency = 9,600

A 75% utilization rate means three-quarters of delivery capacity converted into revenue-generating work.
Why the board wants to know
Utilization directly links capacity to revenue performance. For example, when it decreases, it can be an early sign of revenue problems. Increases, on the other hand, can signal delivery issues or scope creep.
What to watch
A steady drop in utilization indicates problems with the project pipeline, delays in starting projects, or too many hires compared to demand. A sudden increase can boost short-term revenue but may indicate overextension, increased burnout risk, and potential quality issues.
Review trends to compare utilization with hiring pace, bench levels, and employee departures to assess whether changes indicate healthy growth or signs of stress in delivery.
4. Realization rate
The realization rate shows how much of your potential earnings actually turns into invoiced revenue. It helps track the gap between the value you could have billed and the actual invoice.
While utilization tells you the work was performed, realization shows how much of that work actually converted into revenue.
Formulas and examples
In professional services, you can track realization in two ways to measure revenue leakage:
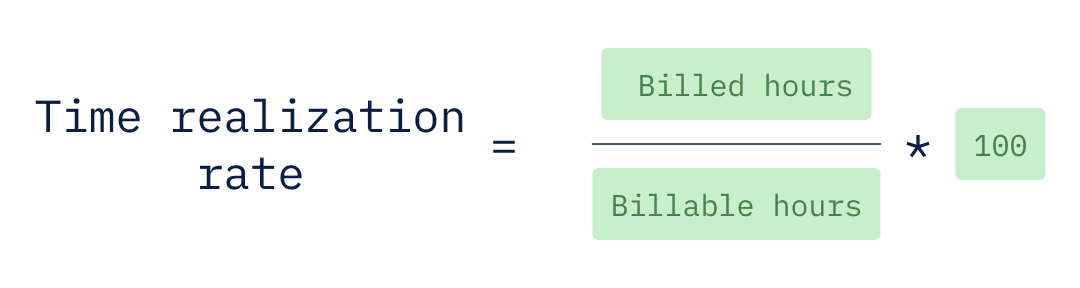
- Time realization rate: Focuses on hours billed versus hours worked.
- Fee realization rate: Looks at whether worked hours were billed at their full expected value.
For board reporting, time realization takes the lead, but you can also use fee realization to provide additional pricing insights.
Recall that billable hours represent the hours that an employee works on client projects and which can be billed for. In other words, those hours represent the amount of the firm’s total delivery capacity that was used on billable client work.
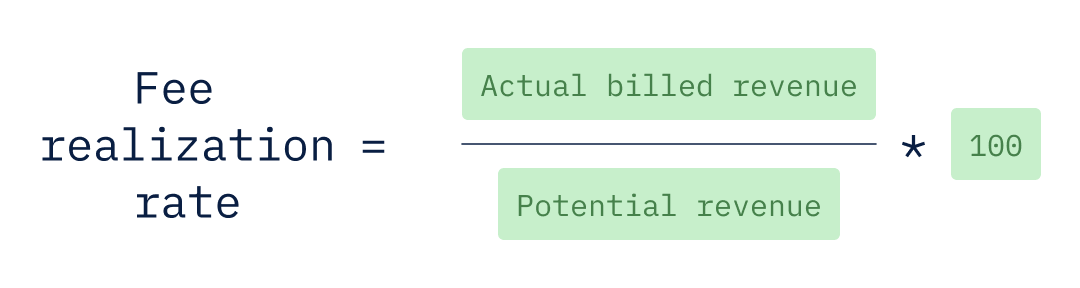
While time realization focuses on hours, fee realization measures whether those hours were billed at their full expected value. The potential revenue in the time realization formula can be calculated by multiplying the total billable hours by the standard rate for your firm.
Since the time realization rate is more important to most boards, let’s run through a quick example of how to calculate it. In this example, the firm’s records show 1,000 billable hours tracked for the delivery but only 900 hours invoiced.
- Billable hours recorded by the delivery team = 1,000
- Billed hours (hours invoiced to clients) = 900

A 90% realization rate means 10% of the delivered value didn’t convert into revenue.
Why the board wants to know
Realization directly impacts margins. Even with strong utilization, declining realization compresses profitability. It’s a signal of profit erosion due to weak scoping, discounting, change control, or delivery overruns. When teams are fully staffed but fail to meet their revenue targets, profit can gradually decline.
What to watch
A downward trend typically signals scope creep, write-downs, pricing pressure, or ineffective change control. An improving trend can reflect tighter project governance or stronger pricing discipline.
To better understand performance, look at both realization and utilization together. High utilization with falling realization indicates the team is working harder without capturing full value, which can ultimately harm profits.
5. Project gross margin
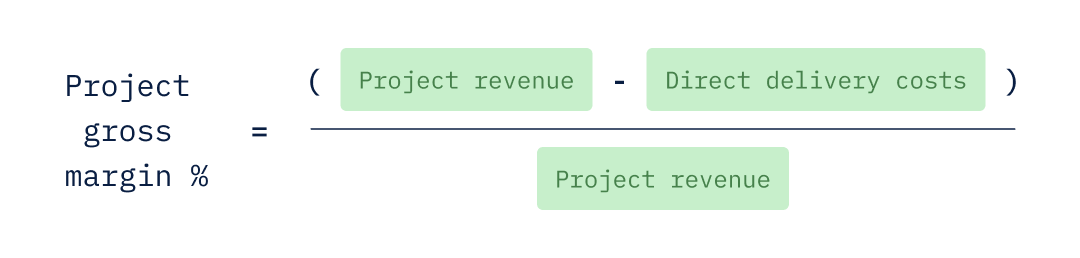
Project gross margin is the profit from your delivery work after subtracting direct costs such as internal labor, contractors, and project-specific expenses, from project revenue.
Formulas and examples
Project gross margin shows how much profit a project generates after direct delivery costs.
As the name suggests, this is a KPI that’s calculated on a per-project basis, so the direct delivery costs are the total expenses for delivering that specific project. They include the cost of internal labor, contractor fees, and project-related expenses, such as travel or tools:
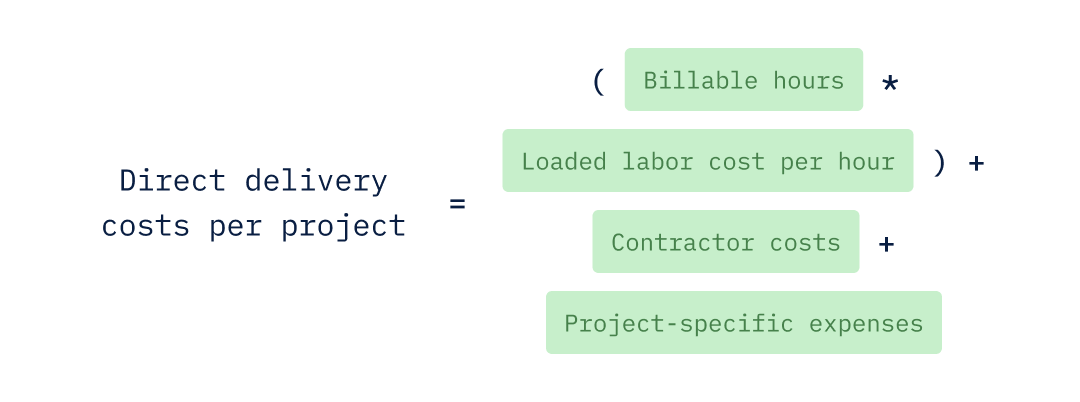
Here, the loaded labor cost per hour is the total cost of delivery staff working for one hour. It includes their salary and all employment-related costs. Keeping employment costs separate from project costs prevents distorted margins and maintains clear pricing.
Let’s look at an example of how to calculate the project gross margin for a project with a $250,000 contract:
- Billable hours on project = 1,000
- Loaded labor cost per hour = $78
- Contractor costs = $45,000
- Project-specific expenses = $12,000
- Direct delivery costs per project = $135,000
- Project revenue = $250,000

A 46% margin means that the firm earned a profit of 46 cents on every dollar made on the project.
Why the board wants to know
For the board, the project gross margin shows how well the company manages pricing, staffing, and costs. It also helps the firm identify problems before they impact the company’s overall profitability.
What to watch
A downward trend indicates issues such as cost overruns, higher labor costs, excessive reliance on contractors, or too low pricing. An improving trend may suggest better planning, pricing changes, or more efficient staffing.
When profit margins change, drill into the cost details to find out if the issue is with pricing, execution, or cost structure.
6. Employee attrition
Employee attrition is the percentage of employees who leave a firm over a set period. Attrition in professional services can hit hard when it happens in roles that generate billable hours. When employees in those roles leave, it disrupts service delivery and revenue.
Formulas and examples
Before calculating the attrition rate, finance teams first determine the average headcount for the period:

The average headcount provides a clear baseline for hiring. Once you have your average headcount, you can plug that into the attrition rate formula:
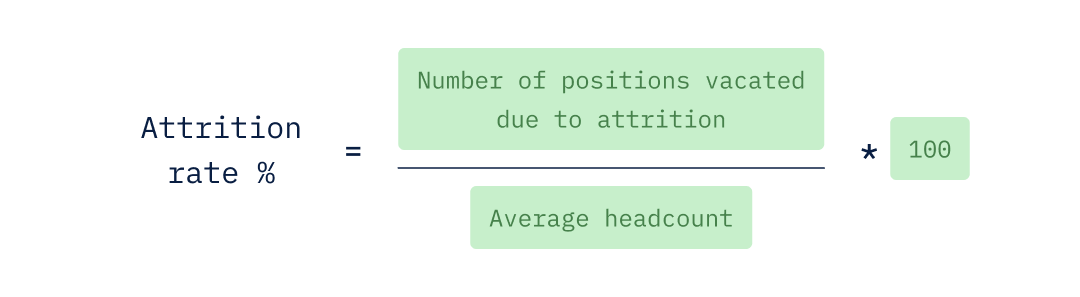
Here’s what the attrition rate would look like for a firm with an average headcount of 115 for the quarter to lose nine of its employees in the same quarter:

Assuming those nine employees were billable, this percentage means our example firm lost 7.83% of its delivery engine in a single quarter.
Why the board wants to know
In professional services, employee attrition is not just an HR metric. It’s a forward-looking capacity and delivery-risk indicator. When billable employees leave, future revenue potential declines. Knowledge walks out the door. Backfills take time, which can temporarily depress utilization and realization.
Boards focus especially on billable attrition because it directly affects delivery continuity and revenue sustainability. However, firms may also track company-wide attrition for organizational health.
What to watch
A rising trend in billable attrition signals delivery stress, cultural friction, or pricing pressure that’s cascading into burnout. A declining rate indicates stability or a weak hiring market.
Compare attrition rates with utilization, bench time, and hiring speed. This will help you assess efficiency and identify delivery issues.
7. Revenue per employee
Revenue per employee shows how much money each employee generates for the firm on average. It measures how effectively the firm is using its employees to generate revenue.
Unlike other professional services metrics that focus on billable employees, this metric considers all employees, including billable employees who generate revenue and employees in supporting roles, such as sales, finance, HR, and management, that enable billable work.
Formulas and examples
Revenue per employee is based on the average headcount. You can refer to the previous section on employee attrition if you need to recall how it is calculated.
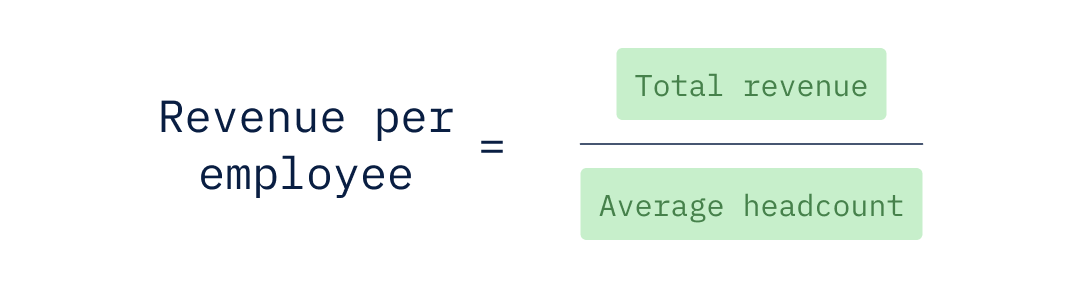
Here’s an example for a firm with an annual revenue of $24,000,000 and an average headcount of 120:

This example shows that each employee generated an average of $200,000 in annual revenue.
Why the board wants to know
Revenue per employee helps boards assess whether growth is being driven by operational efficiency or by simply increasing headcount. It provides a lens into return on labor investment and pairs naturally with margin per employee to evaluate whether scale is improving economics or diluting them.
What to watch
A rising trend usually means improved utilization, stronger pricing, better realization, or higher operational efficiency. A declining trend shows over-hiring, soft demand, or pricing pressure.
When this metric shifts, drill into utilization, realization, and employee-related costs to track and understand the changes in employee-related expenses.
8. Days sales outstanding (DSO)
Days Sales Outstanding (DSO) measures the average days to collect receivables after a sale. It reflects payment-collection efficiency and indicates short-term cash flow risk.
In professional services, revenue isn’t real until it’s collected. DSO closes the loop in the demand-to-cash chain.
Formulas and examples
DSO translates accounts receivable into time. It shows how long revenue sits outstanding after billing.
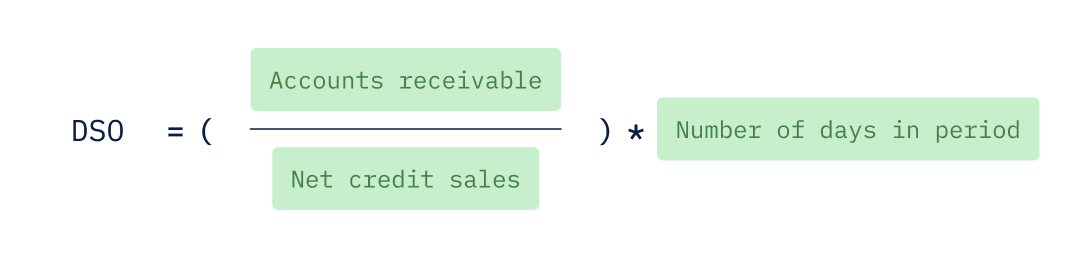
Here’s an example of how DSO is calculated using the following data:
- Accounts receivable (AR) at the end of the month = $900,000
- Net credit sales for the month = $1,500,000
- Days in the month = 30

An 18-day DSO means you're collecting receivables, on average, just 18 days after invoicing.
Why the board wants to know
Rising DSO signals billing delays, client acceptance disputes, unclear scope approvals, or customer financial stress. In professional services, DSO is more than an efficiency metric. It’s an indicator of oversight and delivery quality.
What to watch
An upward DSO trend means invoicing lag, poor control of change orders, or clients pushing payment terms. A declining trend suggests tighter billing cycles and stronger collection discipline.
While there are other ways to calculate DSO, the method here is the most straightforward and provides the information most boards care about, which is the overall direction and consistency of DSO trends.
How professional services teams can automate board reporting
Boards expect clear and consistent reporting and the ability to drill down into different metrics to more fully understand the firm’s performance and any emerging trends, good or bad.
However, when you’re using spreadsheets, giving the board what it wants is always a challenge because of differences in how metrics are defined, tracked, or calculated.
For example, billable and non-billable time may be categorized differently across practices. Realization may be calculated on billed revenue in finance, but on recorded time in delivery.
These differences can require lengthy reconciliation cycles before every board meeting to determine whether “available hours” reported last time exclude holidays, so you can do the same for this report.
Data scattered across different systems makes it even harder. When FP&A teams at professional service firms manually gather data from various sources, combine it in spreadsheets, and make changes, the result is inconsistent logic and a version control nightmare.
Automation with modern FP&A software can eliminate all of these problems, enabling professional services firms to deliver on their board’s expectations consistently and with confidence.
Drivetrain is a comprehensive, robust AI-native FP&A platform that centralizes data from multiple sources, standardizes metric logic, and creates governed reporting layers. It offers:
- 800+ integrations across ERP, HRIS, CRM, time tracking tools, and other finance systems, so data can flow into a unified model without manual exports.
- A custom metric builder allows finance teams to define metrics based on their business model.
- Customized reporting that supports the drill-down capability boards expect, allowing them to filter metrics by client, geography, service line, delivery team, or project type.
- Dynamic dashboards that provide boards with real-time visibility into utilization, margin, cash conversion, and headcount trends, reducing the need for last-minute spreadsheet reconciliations.
Drivetrain helps keep metrics accurate and speeds up reporting, so professional services finance teams can focus on reporting new insights and supporting decision-making rather than arguing over definitions.
Learn more about Drivetrain and how it helps professional services firms track all their KPIs and streamline board reporting.
Frequently asked questions
Finance prioritizes profitability, productivity, and cash discipline. The core metrics that link delivery performance to revenue quality, cost control, and cash conversion are:
- Utilization and realization
- Project gross margin
- Revenue per employee
- Days Sales Outstanding
How often to review professional services metrics depends on a variety of factors, such as the size of your business, the industry you serve, and your client billing model, to name a few.
While there’s no cadence that’s best for all businesses, a useful way to think about it is setting your review frequency for each given metric based on what you want it to tell you or help you achieve. For example:
- Weekly reviews would be the kind that can help you maintain immediate operational control. Reviewing capacity, bench, and utilization on a weekly basis can help prevent revenue loss and guide short-term resource decisions.
- Monthly reviews would be useful for metrics that can help you assess financial performance and delivery quality. Reviewing realization rate, project gross margins, and DSO align well with billing cycles and provide the data needed to evaluate project health and client relationships.
- Quarterly reviews would be suitable for metrics that can help you think strategically about capacity and forecast risk forecasting. This is where reviewing attrition quarterly can reveal systemic patterns that may require longer-term planning to address.
Small teams can usually get away with using spreadsheets, but growing professional services firms need governed, system-integrated reporting for board-grade reliability. When spreadsheets are used at scale:
- Metric definitions can differ.
- Data is mismatched across systems.
- Manual consolidation increases error risk.
- Drill-down capability is limited.
Utilization tracks how much available time is spent on billable work. Realization measures the extent to which billed revenue matches the plan. Utilization is an early warning sign, while realization reveals the damage.
Finance should define available hours using a consistent baseline of standard working hours. It must remain unchanged to ensure that utilization and bench trends accurately reflect operational performance, not fluctuations from accounting or policy changes.
In professional services, revenue per employee shows how effectively the firm is using its employees to generate revenue. Unlike other professional services metrics that focus on billable employees, this metric considers all employees (i.e., total headcount). Using total headcount factors in not only the cost of delivery but also the costs associated with all the other business functions that make that delivery possible, including sales, finance, HR, and management.


.webp)


.svg)