.svg)
.svg)

This article focuses on accounts receivable (AR) and accounts payable (AP) aging reports and how to create them. Learning about these reports will help you better manage cash flows, spot problematic customers early, and build stronger relationships with vendors.
.svg)
.svg)

.svg)

Picture this. You’re the CFO of an early-stage SaaS company, going about your regular day whilst celebrating another month of subscription growth with your stellar team. Then you look at your bank balance and wonder why revenue suddenly seems way off.
To figure it out, the first thing you need to look at is your accounts receivable (AR) and accounts payable (AP) aging reports. These reports help you track which vendors you still need to pay, which customers are yet to pay you, and when.
In this guide, we help you understand the basics of AR and AP aging reports and also provide a step-by-step process to create them.
What are accounts receivable and accounts payable aging reports?
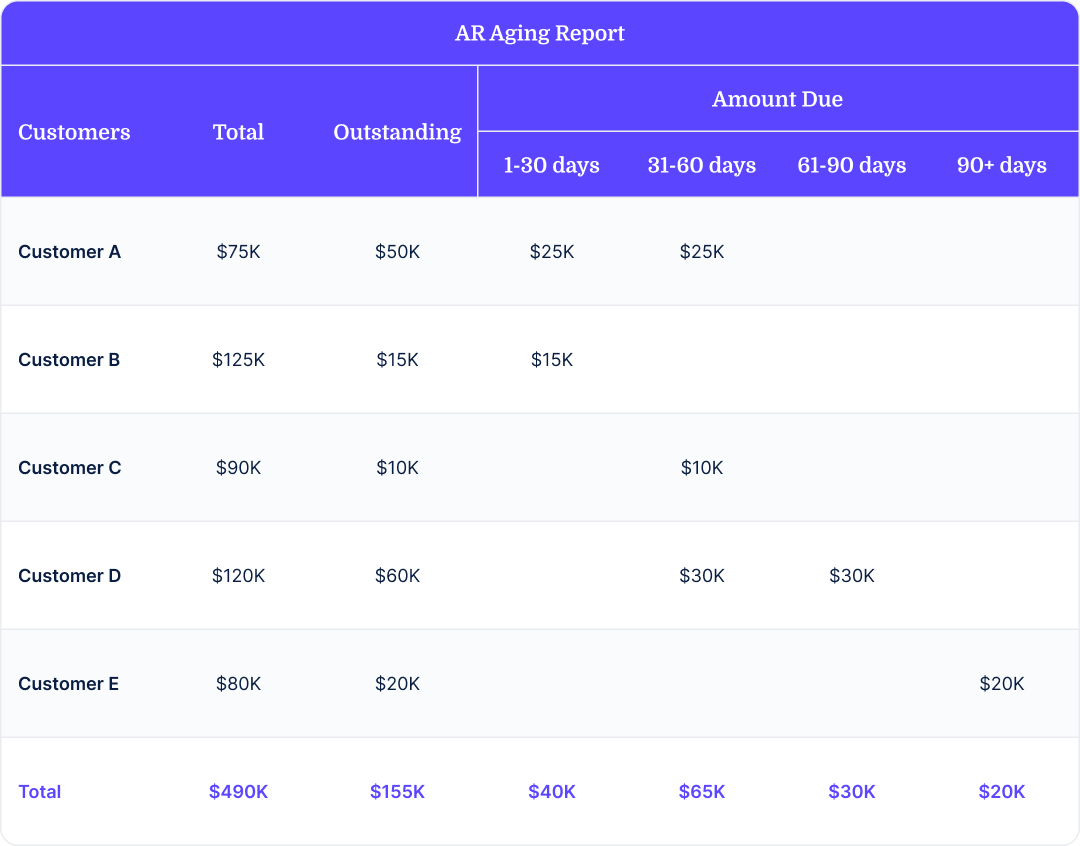
An AR aging report tells who owes you money, how much, and how late they are.
The AR aging report breaks outstanding invoices into categories: 1–30 days overdue, 31–60 days overdue, and so on. This helps you prioritize and optimize collection efforts. Accounts overdue by just a few days might need a slight nudge, while those overdue for months may need stricter follow-ups.
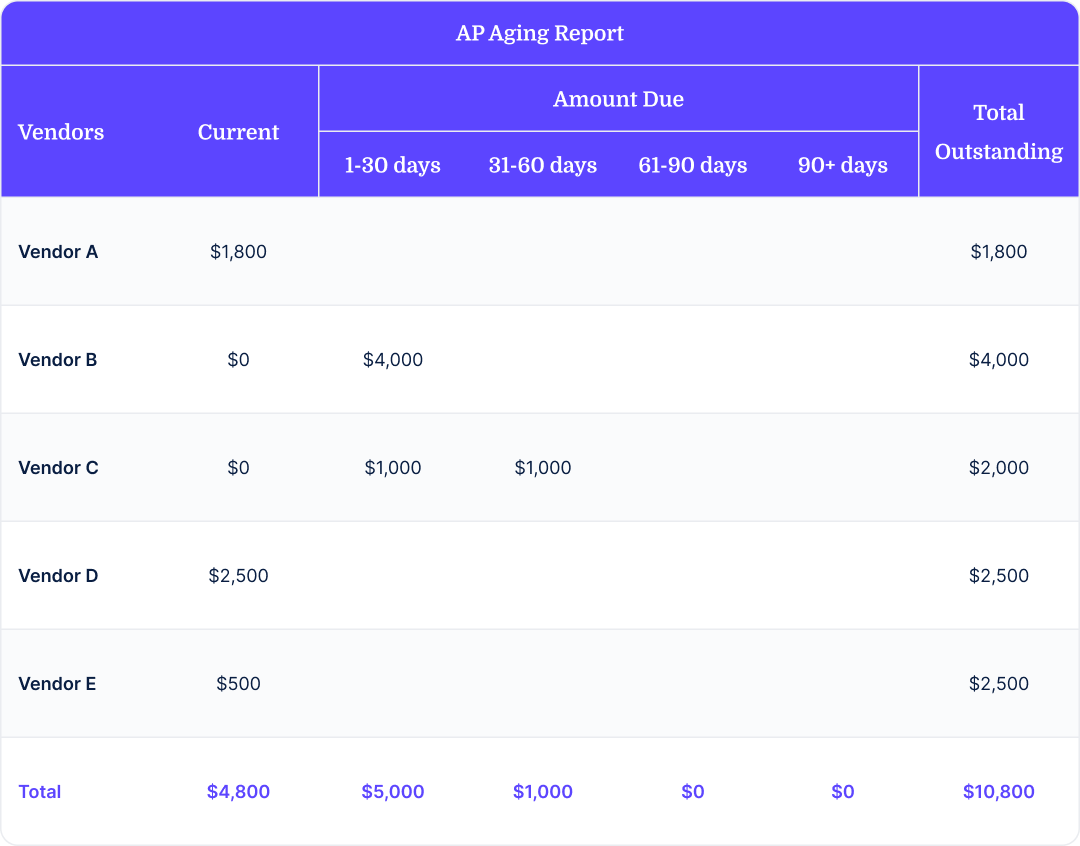
An AP aging report shows who you owe money to, how much, and how far behind you are on those payments.
The idea here is the same as with an AR report—overdue invoices are categorized based on how long they’ve been overdue. Tracking this report helps you better plan your cash flow in the short term so you don’t end up becoming the client who always pays late.
How often should you run AR and AP aging reports?
Deciding how often to run your AP and AR aging reports really depends on how much visibility you need to manage your cash flow effectively.
For enterprise-level businesses, monthly may be sufficient. But for most SMBs, cash management plays a bigger role in the day-to-day operations of the business. This makes running AR aging reports weekly a better option if possible.
It’s worth noting that a weekly, and even a daily frequency if needed, can be easily achieved with the right combination of financial management software and/or financial reporting tools and good integrations.
How can you use AR aging reports in your business?
AR reports live in your books with one key purpose—tracking cash flow problems that may occur due to factors like seasonal trends.
Imagine a startup that billed $50,000 to a client in December for a credit sale. You budgeted for $40,000 in January, but you’re now $25,000 short because the extra-large December invoice is still unpaid.
The reason? It’s probably just an oversight. You know that, like most businesses during this time of year, the client is busy with tax prep and compliance reports. The lesson here is to track your AR aging report and see if there could be a potential cash crunch down the road because of a seasonal trend, tax season, or other factors.
AR aging reports can also help finance teams with:
- Prioritizing collection efforts: They help determine which clients need “gentle reminders” and follow-up emails. Instead of wasting time on small-ticket, on-time payers, concentrate on high-risk, high-value accounts.
- Estimating bad debts and evaluating customer relationships: Aging reports help you calculate allowance for doubtful accounts and reveal repeat offenders. This enables finance teams to build a more realistic bad-debt reserve, avoid overstating profits, evaluate credit policy, and decide whether to continue or discontinue relationships with problematic clients.
- Revisiting credit policies: Identify customers who consistently land in the 60+ or 90+ day buckets. Adjust their credit limits or payment terms. This reduces future delinquency and stabilizes your cash flow.
- Supporting financial reporting: Feed AR aging data into month-end closes to calculate allowance reserves, bad-debt estimates, and DSO metrics for management reports. This helps produce accurate financial statements and deliver critical insights to stakeholders through KPIs.
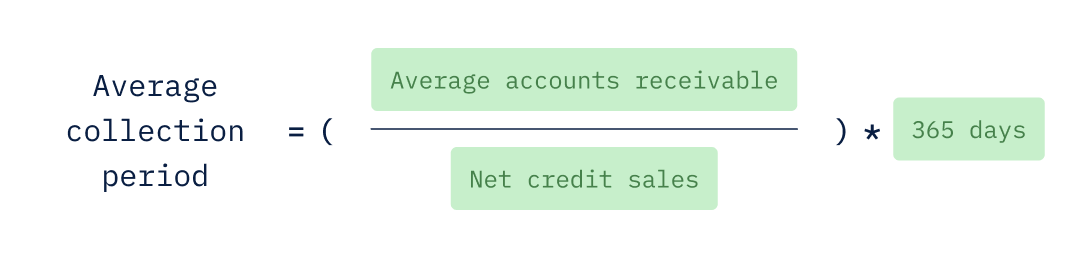
- Determining the average collection period: AR aging reports help you calculate days sales outstanding (DSO). When DSO starts moving up, it’s your cue to re-evaluate credit terms. Use the formula below for average collection period and then track it so you can prevent it from ballooning to avoid cash flow problems.
How can you use AP aging reports in your business?
Like AR aging reports, AP aging reports give you cash flow insights on outflows. If you receive payments on time but delay payments to vendors because you’re cash-strapped or went on an expansion spree, you could be penalized and lose valuable supplier relationships.
Here are other uses of AP aging reports:
- Determining vendor payment timelines: AP aging reports help categorize outstanding bills into buckets so you know exactly how long each supplier invoice has been due. This allows you to prioritize critical vendors and possibly hold off on noncritical ones to extend your cash runway.
- Renegotiating credit policies: If you see vendor invoices consistently outside the agreed credit window, consider renegotiating credit terms, say, from net-30 to net-60. This helps avoid letting go of early payment discounts, maintain healthy supplier relationships, and reduce the possibility of a cash crunch.
- Improving vendor relationships: Use AP aging to send proactive payment alerts to vendors. Vendors appreciate the heads-up more than being ghosted. It keeps your supplier network happy and might earn you better pricing or priority support.
- Supporting financial reporting: Integrate AP aging data into month-end closes to ensure accrued liabilities are correctly recorded on the balance sheet. Also, add footnotes to disclose outstanding obligations. This ensures your financials provide the auditor and stakeholders the necessary details, and management can see a clear picture of cash that’s about to flow out.
Components of AR and AP aging reports
While the components of AR and AP aging reports are pretty similar, we’ve detailed them separately here for better understanding. Let’s take a look.
Components of an accounts receivable aging report
A typical AR aging report includes:
- Customer information: Name, account number, billing address, email, and phone number.
- Invoice details: Invoice number, description of goods/services, and the total amount owed.
- Invoice date: This is crucial because it kicks off the credit-period countdown. Always check the date before hitting send.
- Aging categories: Invoices are sorted into buckets, such as 1–30 days past due and 31–60 days past due.
- Outstanding balances: The amount each customer owes and in which aging bucket. This is your “big picture” view of cash coming in over the next 30, 60, or 90 days (assuming things go as planned).
- Credit memos: These are credits or returns you’ve issued that reduce the amount a customer owes you. If you don’t subtract these, you might end up charging a customer for products they have returned.
- Total amounts: These are the grand totals for each aging bucket and the overall AR balance that tells CFOs how much working capital is stuck in receivables.
- Notes and comments: These annotations give your collections team context so they don’t bother the customer who’s legitimately waiting on an internal PO approval.
Components of an accounts payable aging report
An AP aging report includes:
- Vendor information: Vendor name, account code, billing address, and preferably a contact person and their contact details.
- Invoice details: Invoice number, description of goods/services you purchased, and the total amount due.
- Invoice date: The date on which the vendor raises the invoice is when the clock starts on your payment terms. Make sure this data is accurately mentioned to avoid last-minute scrambling.
- Aging categories: Just like AR, AP aging reports categorize invoices by the number of days past due.
- Total amounts owed (including payment status): This shows the total outstanding amount for each invoice. It tells you how much cash will flow out over the next 30, 60, or 90 days, so you can assess if you’re prepared to meet your payment promises.
- Notes and comments: These provide additional insights that keep your AP team aligned and prevent embarrassing slip-ups like paying a disputed invoice.
Significance of aging reports on SaaS cash flow and decision-making
Aging reports can be considered to be your SaaS business’ financial radar, lie detector, and early warning system. Here’s why they matter for your SaaS business:
Cash flow visibility and predictability
Aging reports help you predict when cash might flow in or out according to your accounts receivable and payable management. If you notice a pattern among customers who consistently make late payments, consider tightening your collections process to bring in cash faster.
Financial health checkup
Aging reports reflect how well or poorly you’re managing your obligations on both sides of the ledger. Aging receivables signal that you’re basically giving out interest-free loans. On the other hand, aging payables beyond a limit can get you on vendor blocklists.
Bad debt prevention
That one customer who’s always “circling back”? The aging report finds them for you. You can use aging reports to spot habitual late payers, evaluate your credit policies, and take action before their payables turn into write-offs. This is more of a problem for enterprise SaaS, where subscription money may not be paid upfront due to multi-year contracts or usage-based subscription agreements.
Customer relationship and retention signal
Consistent late payments can signal an impending spike in churn. Aging receivables give your customer success and finance teams the heads-up to intervene and take actions to safeguard customer relationships and your financial position.
Impact on financial statements
Aging reports can have a negative impact on your financial statements. Let’s see how:
- On the balance sheet, overdue AR forces you to provision for doubtful accounts (reducing the net receivables figure).
- On the income statement, bad debt provisions from uncontrollable AR reduce your profit. At the same time, AP mismanagement can increase expenses via late-fee penalties or lost early-pay discounts.
- Then there’s the cash flow statement. Slow AR collections inflate reported income without real cash, and an increase in AP results in higher cash flow from operations, making your operating cash flow look healthier than it truly is.
How to create AR and AP aging reports for your SaaS business
Now the process of creating AR and AP aging reports is similar given the overlap in the components of both reports. The process typically involves the following steps:
- Step 1: Gather invoice information: Pull all unpaid customer invoices and outstanding vendor bills from your invoicing system.
- Step 2: Determine due dates and days past due: For each invoice, both receivable and payable, calculate Days Past Due (which is Today’s Date - Invoice Date - Allowed Credit Terms). Add notes and comments where necessary. For example, “disputed over feature downtime” or “30-day pilot extension.”
- Step 3: Define aging periods and group invoices accordingly: Split invoices into buckets like 0–30 days, 31–60 days, 61–90 days, and 90+ days. If you’re a SaaS company that offers annual prepaid plans, you might add a “Prepaid vs. Overdue” bucket to differentiate cash-in-advance from late payers.
- Step 4: Categorize invoices by customer/vendor within each bucket: Sort each receivable and payable invoice into its appropriate age bucket, and within each bucket, group by customer or vendor and then by due date. This allows you to see, for example, which “31–60 day” invoices are about to tip into “61–90 day” territory next week.
- Step 5: Calculate total amounts owed: Sum the balances in each aging bucket on both the AR and AP reports. Compare the AR and AP totals to spot potential cash runway gaps. This is especially critical when you’re burning through VC money between funding milestones.
- Step 6: Review and reconcile: This is the final step where you tie up loose ends. Cross-check your aging buckets against your general ledger subledgers. Investigate anomalies like duplicate entries and invoices paid but not marked as “paid” in your system. Lastly, finalize your report and flag action items for collections (on the AR aging report) and payment scheduling (on the AP aging report).
Once your reports are ready, you can use any component of them to do a more detailed analysis of your financials to check for trends, opportunities, or risks. For example, you may choose to analyze AR-related SaaS metrics, including DSO, accounts receivable turnover ratio, etc., to predict and manage your cash flow more effectively.
Creating these reports is pretty simple. The challenge lies in managing data. Many companies use Excel spreadsheets and manual workflows to keep costs to a minimum early on. However, as the business grows, manually managing customer and vendor payment data across multiple spreadsheets is a recipe for erroneous records. The right financial planning and analysis (FP&A) tool can eliminate spreadsheet headaches and make the kind of analysis described above fast and easy.
Conclusion
Cash flow surprises are rarely random. When you trace most of them back, there's almost always an aging report somewhere that had the early signal weeks before the problem showed up on the cash statement. A customer account sitting at 61 to 90 days past due doesn't become a collection problem overnight. The risk builds gradually, and regular attention to the aging report is what gives finance teams the time to act before it becomes a write-off conversation.
The same logic applies on the AP side. Vendor relationships that get strained because payments are chronically late, or early payment discounts that get missed because no one's reviewing due dates with any regularity, are preventable costs. The AP aging report is the tool that keeps those decisions visible and deliberate rather than accidental.
What often limits the usefulness of these reports is the effort required to produce them. When AR data lives in the billing system and AP data is in the ERP, and neither feeds cleanly into a single view, finance teams end up running the analysis less often than they should. Closing that data gap is what makes the discipline sustainable at scale, and it's one of the core problems that connected financial planning platforms like Drivetrain are designed to solve.

Mona Sharma is a Senior Finance Manager and Chartered Accountant with over seven years of experience across controllership, MIS reporting, statutory audit, and startup finance. She spent over three years at Deloitte working on diagnostic reviews, IFC engagements, and risk control matrices. At BeepKart, she managed the full finance function, including Series A due diligence, FDI restructuring, debt fundraising, and monthly close processes. At Drivetrain, Mona writes about controller best practices, financial close processes, compliance and audit workflows, and how finance teams can build scalable accounting operations.
FAQs
What is aging in AR reporting?
Aging of accounts receivable refers to the duration of unpaid customer invoices. It’s expressed and tracked using an AR aging report where invoices are segregated into groups based on the duration they have been due.
How do you prepare or create an AR aging report?
The process of creating an AR aging report typically involves the following steps:
- Step 1: Gather all unpaid customer invoices from your invoicing system.
- Step 2: Determine due dates and days past due and calculate Days Past Due (which is Today’s Date - Invoice Date - Allowed Credit Terms). Add notes and comments where necessary.
- Step 3: Define aging periods and group invoices accordingly: Split invoices into buckets like 0–30 days, 31–60 days, 61–90 days, and 90+ days. Note: If you’re a SaaS company that offers annual prepaid plans, you might add a “Prepaid vs. Overdue” bucket to differentiate cash-in-advance from late payers.
- Step 4: Sort each receivable into its appropriate age bucket, and within each bucket, group by customer and then by due date. This allows you to see, for example, which “31–60 day” invoices are about to tip into “61–90 day” territory next week.
- Step 5: Calculate the total amount overdue by summing the balances in each aging bucket on the AR report.
- Step 6: Review and reconcile by cross-checking your aging buckets against your general ledger subledgers. Investigate anomalies like duplicate entries and invoices paid but not marked as “paid” in your system. Lastly, finalize your report and flag action items for collections.
How often should businesses run or review an AR aging report?
Deciding how often to run your AP and AR aging reports really depends on how much visibility you need to manage your cash flow effectively.
For enterprise-level businesses, monthly may be sufficient. But for most SMBs, cash management plays a bigger role in the day-to-day operations of the business. This makes running AR aging reports weekly a better option if possible.
It’s worth noting that a weekly, and even a daily frequency if needed, can be easily achieved with the right combination of financial management software and/or financial reporting tools and good integrations.


.webp)