.svg)
.svg)
.png)

Financial statements play a central role by helping teams understand what’s driving performance.
At the center of this are two core reports: the income statement and the balance sheet. They’re often discussed together, but fundamentally serve different purposes.
The income statement tracks performance over a period, showing how much a company earned, what it spent, and whether it generated a profit or loss.
The balance sheet complements this by capturing the company’s financial position at a specific point in time, including what it owns, what it owes, and what remains for shareholders.
This guide goes beyond definitions to focus on what actually matters in practice, when to use each statement, how they connect, and the real challenges finance teams face when building them.
The two statements are often discussed together, but they provide distinct information. Here's a side-by-side breakdown of what sets them apart.
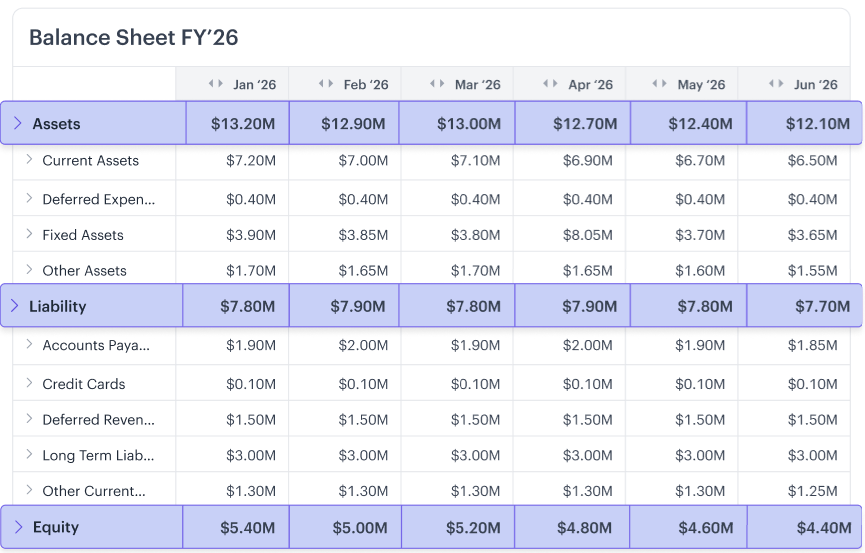
What is a balance sheet?
A balance sheet reports a company's financial position at a specific point in time. It lays out what the business owns, what it owes, and what’s left for shareholders.
What goes on a balance sheet
A balance sheet is a snapshot of what a company owns, owes, and what remains for shareholders at a given point in time. It has three core components:
- Assets are the resources a company owns that have economic value and are expected to provide future benefits. Examples of these are cash, accounts receivable, and inventory in the short term, and property, equipment, and long-term investments in the long term.
- Liabilities are the company’s financial obligations or debts to others. Examples of these are accounts payable, short-term loans, and accrued expenses in the short term, and debt and bonds payable in the long term.
- Equity represents what would be left for shareholders if all assets were sold and all liabilities were paid off. It’s also known as shareholders’ equity or net worth.
The balance sheet equation
At its core, a company’s finances come down to a simple relationship: everything it owns is funded either by debt or by the owners’ investment.
Assets = Liabilities + Equity
The balance sheet equation must always hold true. When one side of the equation doesn’t equal the other, something is wrong. The error could be misclassified entries or missing accruals, or it could be a modeling error. Going back to your balance sheet reconciliation is a good place to start looking for the problem.
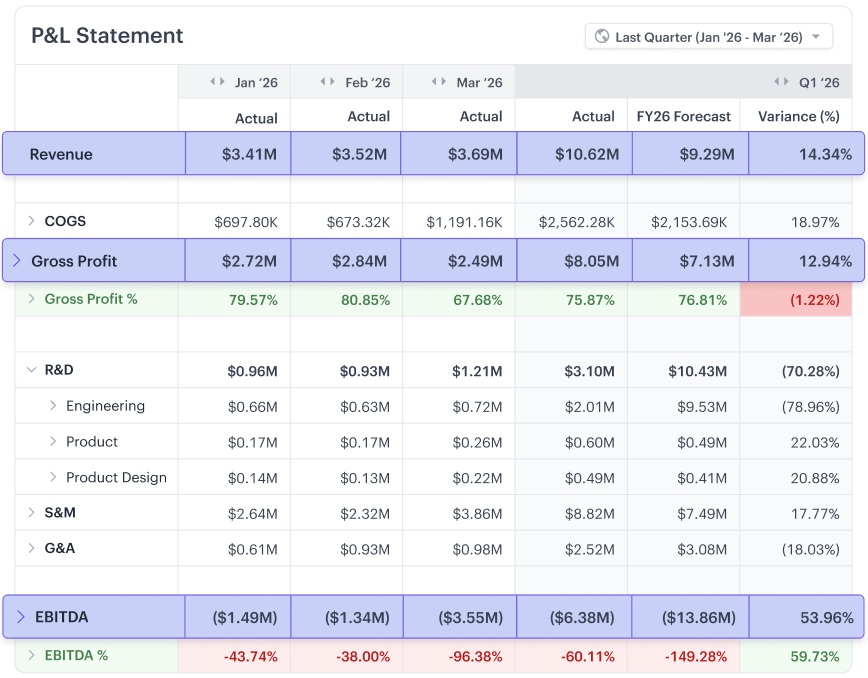
What is an income statement?
An income statement, aka profit and loss statement (P&L), shows whether a business made or lost money over a given period. It helps you understand how well the company generates revenue from its operations and provides insight into profitability.
What goes on an income statement
To see how profit and loss is calculated, we need to break down the key components of the income statement:
- Revenue reflects the total income generated from its core business activities.
- Expenses are the costs of running the business. They include cost of goods sold (COGS), operational expenses (e.g., salaries, rent, utilities, depreciation, and marketing costs), as well as taxes.
- Net income is what remains after all expenses are deducted from the revenue. If net income is positive, the company made a profit during the reporting period. If it’s negative, the company incurred a loss.
Income statement formula
At its simplest, profitability comes down to what a business earns versus what it spends over a period.
Net income = Revenue - Expenses
How is the income statement related to the balance sheet?
To understand how the income statement and balance sheet are linked, it helps to zoom out briefly. These are two of the three core financial statements, and they are designed to work together, each capturing a different part of the same underlying activity.
The income statement shows performance over a period, the cash flow statement tracks how cash moves, and the balance sheet reflects the company’s financial position at a point in time.

Performance is reflected in the P&L. Total revenue for the period feeds the top line of the P&L statement, which sums to net income. The net income reported on the income statement represents the difference between revenues and expenses, but it doesn’t necessarily reflect the actual cash inflows and outflows during the period.
Cash movement is captured by the cash flow statement. Net income is the starting point in the operating section of the cash flow statement (under the indirect method), but it’s rarely equal to ending cash. This is because accounts receivable and payable can affect cash flow without an immediate impact to net income.
Inventory has a similar effect because it affects cash when it's purchased, but doesn't hit the income statement until it's sold. If these two events fall in different periods, it creates a gap between net income and ending cash.
Financial position is reflected in the balance sheet, which is the final piece of the interconnected, three-statement model. Ending cash flows into it from the cash flow statement, and net income affects it through retained earnings.
Retained earnings are the portion of a company's net income not distributed to shareholders as dividends but reinvested in the business instead. At the end of each reporting period, the net income (or loss) from the income statement is added to or subtracted from the retained earnings account on the balance sheet.
Because all three statements are designed to work together to tell the company’s financial story, it’s important to look at them together to understand it fully.
For example, if a small business earns $100,000 in revenue during a month and has $70,000 in expenses (all paid in cash during the same month), the net income shown on its P&L is $30,000.
At the period close, that $30,000 flows into retained earnings automatically, increasing equity on the balance sheet.
If $20,000 of that revenue is still unpaid by customers (i.e., sitting in accounts receivable), only $80,000 of the cash was actually received. The cash flow statement adjusts for this difference. As a result, the ending cash on the balance sheet increases by $10,000, not $30,000.
The retained earnings balance and the cash balance are telling two parts of the same story, and you need all three statements to see it clearly.
When should you use the income statement vs. balance sheet?
In practice, the choice is not about the report. It is about the decision you are trying to make.
Different stakeholders start in different places, but no one relies on just one statement. The income statement explains performance over time, while the balance sheet shows financial position at a specific point in time. The real insight comes from connecting the two.
External stakeholders use them to decide whether to invest, lend, or engage with a business. Internal teams use them to allocate resources, manage risk, and plan for growth.
How investors use the balance sheet and income statement
Around 69% of investment professionals rely heavily on financial statements when making decisions.
While potential investors use all three statements, they often start with the income statement to understand growth, margins, and profitability, all of which help to determine whether the business is worth investing in.
They then validate that story using the balance sheet. This shows whether the company has the financial strength to sustain performance, including sufficient cash, manageable debt, and the ability to fund future growth.
Strong earnings alone are not enough. Investors look for earnings that are supported by a solid financial position.
Together, the balance sheet and income statement help investors:
- Evaluate the sustainability of profits
- Assess risk and return
- Compare performance against peers using margin and return ratios
How lenders use the balance sheet and income statement
Lenders focus first on risk.
They typically start with the balance sheet to assess liquidity, leverage, and overall financial stability. This helps answer whether the company can repay its debt. For example, they look at whether current assets are sufficient to cover short-term liabilities, which indicates the company’s ability to meet near-term obligations.
They then review the income statement to evaluate how consistently the business generates earnings.
What matters most is whether those earnings translate into reliable cash flows. Lenders use metrics such as coverage ratios (which show whether earnings can service debt) and leverage ratios (which indicate how much debt the company is already carrying) to determine whether the business can comfortably service its debt.
In simple terms, a balance sheet shows the ability to repay, and the income statement shows consistency of earnings. Both are essential to assess creditworthiness.
How tax authorities use the balance sheet and income statement
Tax authorities use both the balance sheet and income statement for companies of all sizes, public or private, for compliance and verification.
The income statement determines taxable income, while the balance sheet helps validate reported assets and liabilities. Together, they ensure that financial reporting aligns with applicable laws and regulations.
How finance teams and leaders use both for strategic decisions
Internal teams always use these statements together.
They use the income statement to track performance, including revenue, costs, and profitability. And they use the balance sheet to understand what’s driving that performance, including working capital, debt levels, and asset structure.
For example, understanding a company’s cash runway requires both:
- The balance sheet shows available cash
- The income statement shows burn rate and earning capacity
Together, they help leaders answer critical questions, such as:
- How long can we operate at current performance?
- Should we raise capital, and if yes, through debt or equity?
- Where should we allocate resources for growth?
So, which is more important: the balance sheet or the income statement?
Looking at one without the other can lead to incomplete or even misleading conclusions. The real insight comes from reading them together, understanding how performance translates into financial strength, and how financial strength supports future performance.
What challenges do finance teams face when creating balance sheets and income statements?
Building financial statements well takes more than knowing the rules. Having supported thousands of financial models over the years, here are the issues that finance professionals have seen again and again, even in sophisticated finance teams:
1. Aggregating data from multiple sources
For companies operating across different geographic regions and managing multiple currencies and FX rates, ERP data consolidation is one of the most time-consuming parts of financial reporting.
Most ERPs are not designed to produce flexible, customized three-statement reports. As a result, finance teams end up exporting data, mapping it manually, cleaning it, and rebuilding the same reports every month.
This process is not just inefficient. It increases the risk of errors and makes it harder to trust the final output.
2. Keeping revenue and expense recognition aligned on the income statement
Finance professionals working in both cash and accrual contexts need to continuously align timing. Expenses and revenues must be recognized when they are earned or incurred, not when cash moves, and that distinction can become harder to maintain under reporting pressure. The problem compounds when large prepaid amounts, deferred costs, or annual contracts are involved.
For example, a SaaS business might sign a $120K annual contract in January, receive full cash payment upfront. this case, the full $120K would be recorded as deferred revenue, and $10K would be recognized each month as service is delivered.
There are a couple of common missteps to note here. If the finance team recognizes the entire $120K in January, it will artificially inflate the Q1 revenue. If they correctly defer the revenue, but frontload all the costs of delivering that contract, it will artificially depress the Q1 margin.
“The instinct to recognize expenses as soon as the cash flows out of the business is natural. But viewed through an accrual lens, doing so can materially distort margins in periods where there are large prepaid amounts, deferred costs, or when annual contracts are amortized. Building and tracking accruals via an accrual calendar, tied to real vendor and customer contracts, removes the guesswork when month-end close rolls around." – Kirk Kappelhoff, Senior Director, Strategic Finance at Drivetrain
Without a system that ties recognition to actual contract milestones, teams are making a judgment call every period. That judgment tends to drift, especially under time pressure at quarter-end.
3. Maintaining alignment across financial statements
The balance sheet and income statement are two views of the same business. In practice, however, they are often built in silos.
Every movement on the balance sheet, whether in accounts receivable, accounts payable, or inventory, must reconcile with what is happening in the income statement and cash flow.
If revenue grows by 20% but accounts receivable does not move accordingly, something is off. It could be incorrect revenue recognition, inconsistent cash assumptions, or broken linkages in the model.
The issue becomes more visible during scenario planning. A model that works in a base case but breaks under upside or downside scenarios likely has hidden assumptions or weak linkages.
Across all three challenges, the underlying issue is the same. Financial statements are often built as static outputs instead of connected systems.
This is where modern FP&A tools like Drivetrain change how teams operate. Instead of rebuilding reports every month, teams can:
- Bring data from multiple systems into one place
- Tie revenue and expense recognition directly to contracts and schedules
- Ensure the balance sheet, income statement, and cash flow stay connected under all scenarios
The result is more reliable decision-making. When assumptions change, the model updates without breaking. When questions come up, teams can explore test scenarios and find answers without starting from scratch.
Ultimately, strong financial statements are about building a system that holds up under pressure, scales with the business, and reflects reality as it evolves.
Want a simple way to get started? Download Drivetrain’s three-statement model template. It will help you build linked financial statements quickly and run basic scenarios without starting from scratch.
Frequently asked questions
The three financial statements are linked because they track the same business from different angles. The income statement shows profit over a period. That profit (net income) flows into the balance sheet as retained earnings. The cash flow statement starts with net income and adjusts it to show actual cash movement. The ending cash then appears on the balance sheet. Together, they connect performance, cash, and financial position.
The income statement (P&L) comes first. Net income is required to update retained earnings, which is part of equity on the balance sheet.
Net income flows into retained earnings in the equity section of the balance sheet, after accounting for dividends. This explains how profit affects your company’s financial position over time and shows where shareholder value is growing.
Profit and cash often diverge because of accrual accounting. Revenue is recorded when earned and expenses when incurred—even if cash hasn’t moved. For example, invoicing a customer boosts profit immediately, but cash only arrives upon payment. The income statement shows the performance, while the balance sheet captures the timing gap through receivables and deferred revenue.
Balances like cash, inventory, retained earnings, and debt sit on the balance sheet, while the income statement only shows the activity that drives net income.
This is because they measure two fundamentally different things. The balance sheets measure what a company owns and owes at any given time, which is only meaningful as a point-in-time snapshot. Income statements, by contrast, measure a flow, tracking revenues and expenses over time to show performance. At the end of the period, those results flow into retained earnings on the balance sheet, linking performance to position.
Public companies report quarterly and annually. Internally, most teams prepare them monthly to track performance and maintain accuracy.
Net income from the income statement flows directly into the equity section of the balance sheet as retained earnings. If a company earns a profit, retained earnings increase; if it reports a loss, they decrease. Any dividends paid out further reduce retained earnings.


.webp)


