.svg)
- Analyzing your New ARR growth performance against benchmarks
- Funnel planning to forecast the pipeline needed
- Determining the additional headcount needed to achieve your target
- Overcapacity planning to account for average quota attainment rate
.svg)
.svg)

.svg)

What is the best way of creating models that accurately predict future business performance? In our SaaS Metrics Based Top Down Revenue Modeling eBook we illustrated a top-down approach where we defined goals and adjusted business drivers accordingly. We concluded by calculating important downstream operating metrics for our fictitious Acme Inc.
As with most fast-growing SaaS startups, we assumed the meeting the Rule of 40 was critical to Acme Inc’s valuation and revenue goals. Revenue growth is a major part of this puzzle, and your New ARR plan (also called new customer acquisition plan, new logo plan, new business plan, or new bookings plan) is critical to maintaining a steady number.
In this handbook, we illustrate how you can build a top-down New ARR plan that will help you achieve your growth goals. We will walk through the various assumptions and steps you need to execute when creating your New ARR plan. As with our previous eBook, we will use Acme Inc as an example.Let’s begin with the first step, where we examine two critical financial ratios.
Step 1 : Check how aggressively you can pursue New ARR growth
How aggressively should you focus on new customer acquisition?Here are a couple handy ratios that help you answer this question.
LTV to CAC ratio
The customer lifetime value (LTV) to the customer acquisition cost (CAC) indicates how efficiently you’re acquiring customers. Are you spending too much to acquire them or not enough?
We recommend using the following formulas to compute your LTV and CAC:
Here’s how you can evaluate your LTV to CAC result:
CAC Payback Period
The CAC payback period is the second ratio that helps you figure out how aggressively you should focus on New ARR planning. This number indicates the efficiency of your sales and marketing efforts when acquiring a new customer.
It classifies these efforts in terms of the number of months needed to recover your investment.
You can calculate your CAC payback period using the formula below:
The lower your CAC payback period, the more efficient your spending is. If the payback period is too long, you need to address what’s behind that issue before you embark on new ARR planning.
Fast-growing businesses with a shorter sales cycle should aim for a CAC payback period of five months to a year. Businesses with longer sales cycles, such as large enterprises, will experience longer payback periods.If these two ratios look good, it’s time to start building your New Business ARR plan.
Step 2 : Perform Funnel Calculations
Building your New Business ARR plan is a two-part process. These parts are:
- Funnel calculations to forecast the pipeline needed
- Capacity matching to determine the additional capacity (personnel) required to achieve your target.
Before diving into funnel calculations, let’s set the stage with some assumptions and sample metrics. For continuity and simplicity, we will continue with the example shared in the SaaS metrics based planning guide. Here’s a summary:
Acme is a fast-growth SaaS company with an annualized run rate (ARR) of $30 million, operating in US and EU markets and catering to two market segments.
Targets set by the board are as follows:
- Growth rate: 100%
- GRR: 80%
- NRR: 130%
- Gross margin: 80%
- Rule of 40
From the above numbers, we calculated a New Business ARR target and other associated metrics as listed below.
With these numbers in place, let’s get started with our funnel calculations.tart simple and include only high-impact assumptions in your funnel calculations. These are :
Volume metrics: Average deal size and number of leads.
Efficiency metrics: Conversion rates across stages from lead to closed-won.
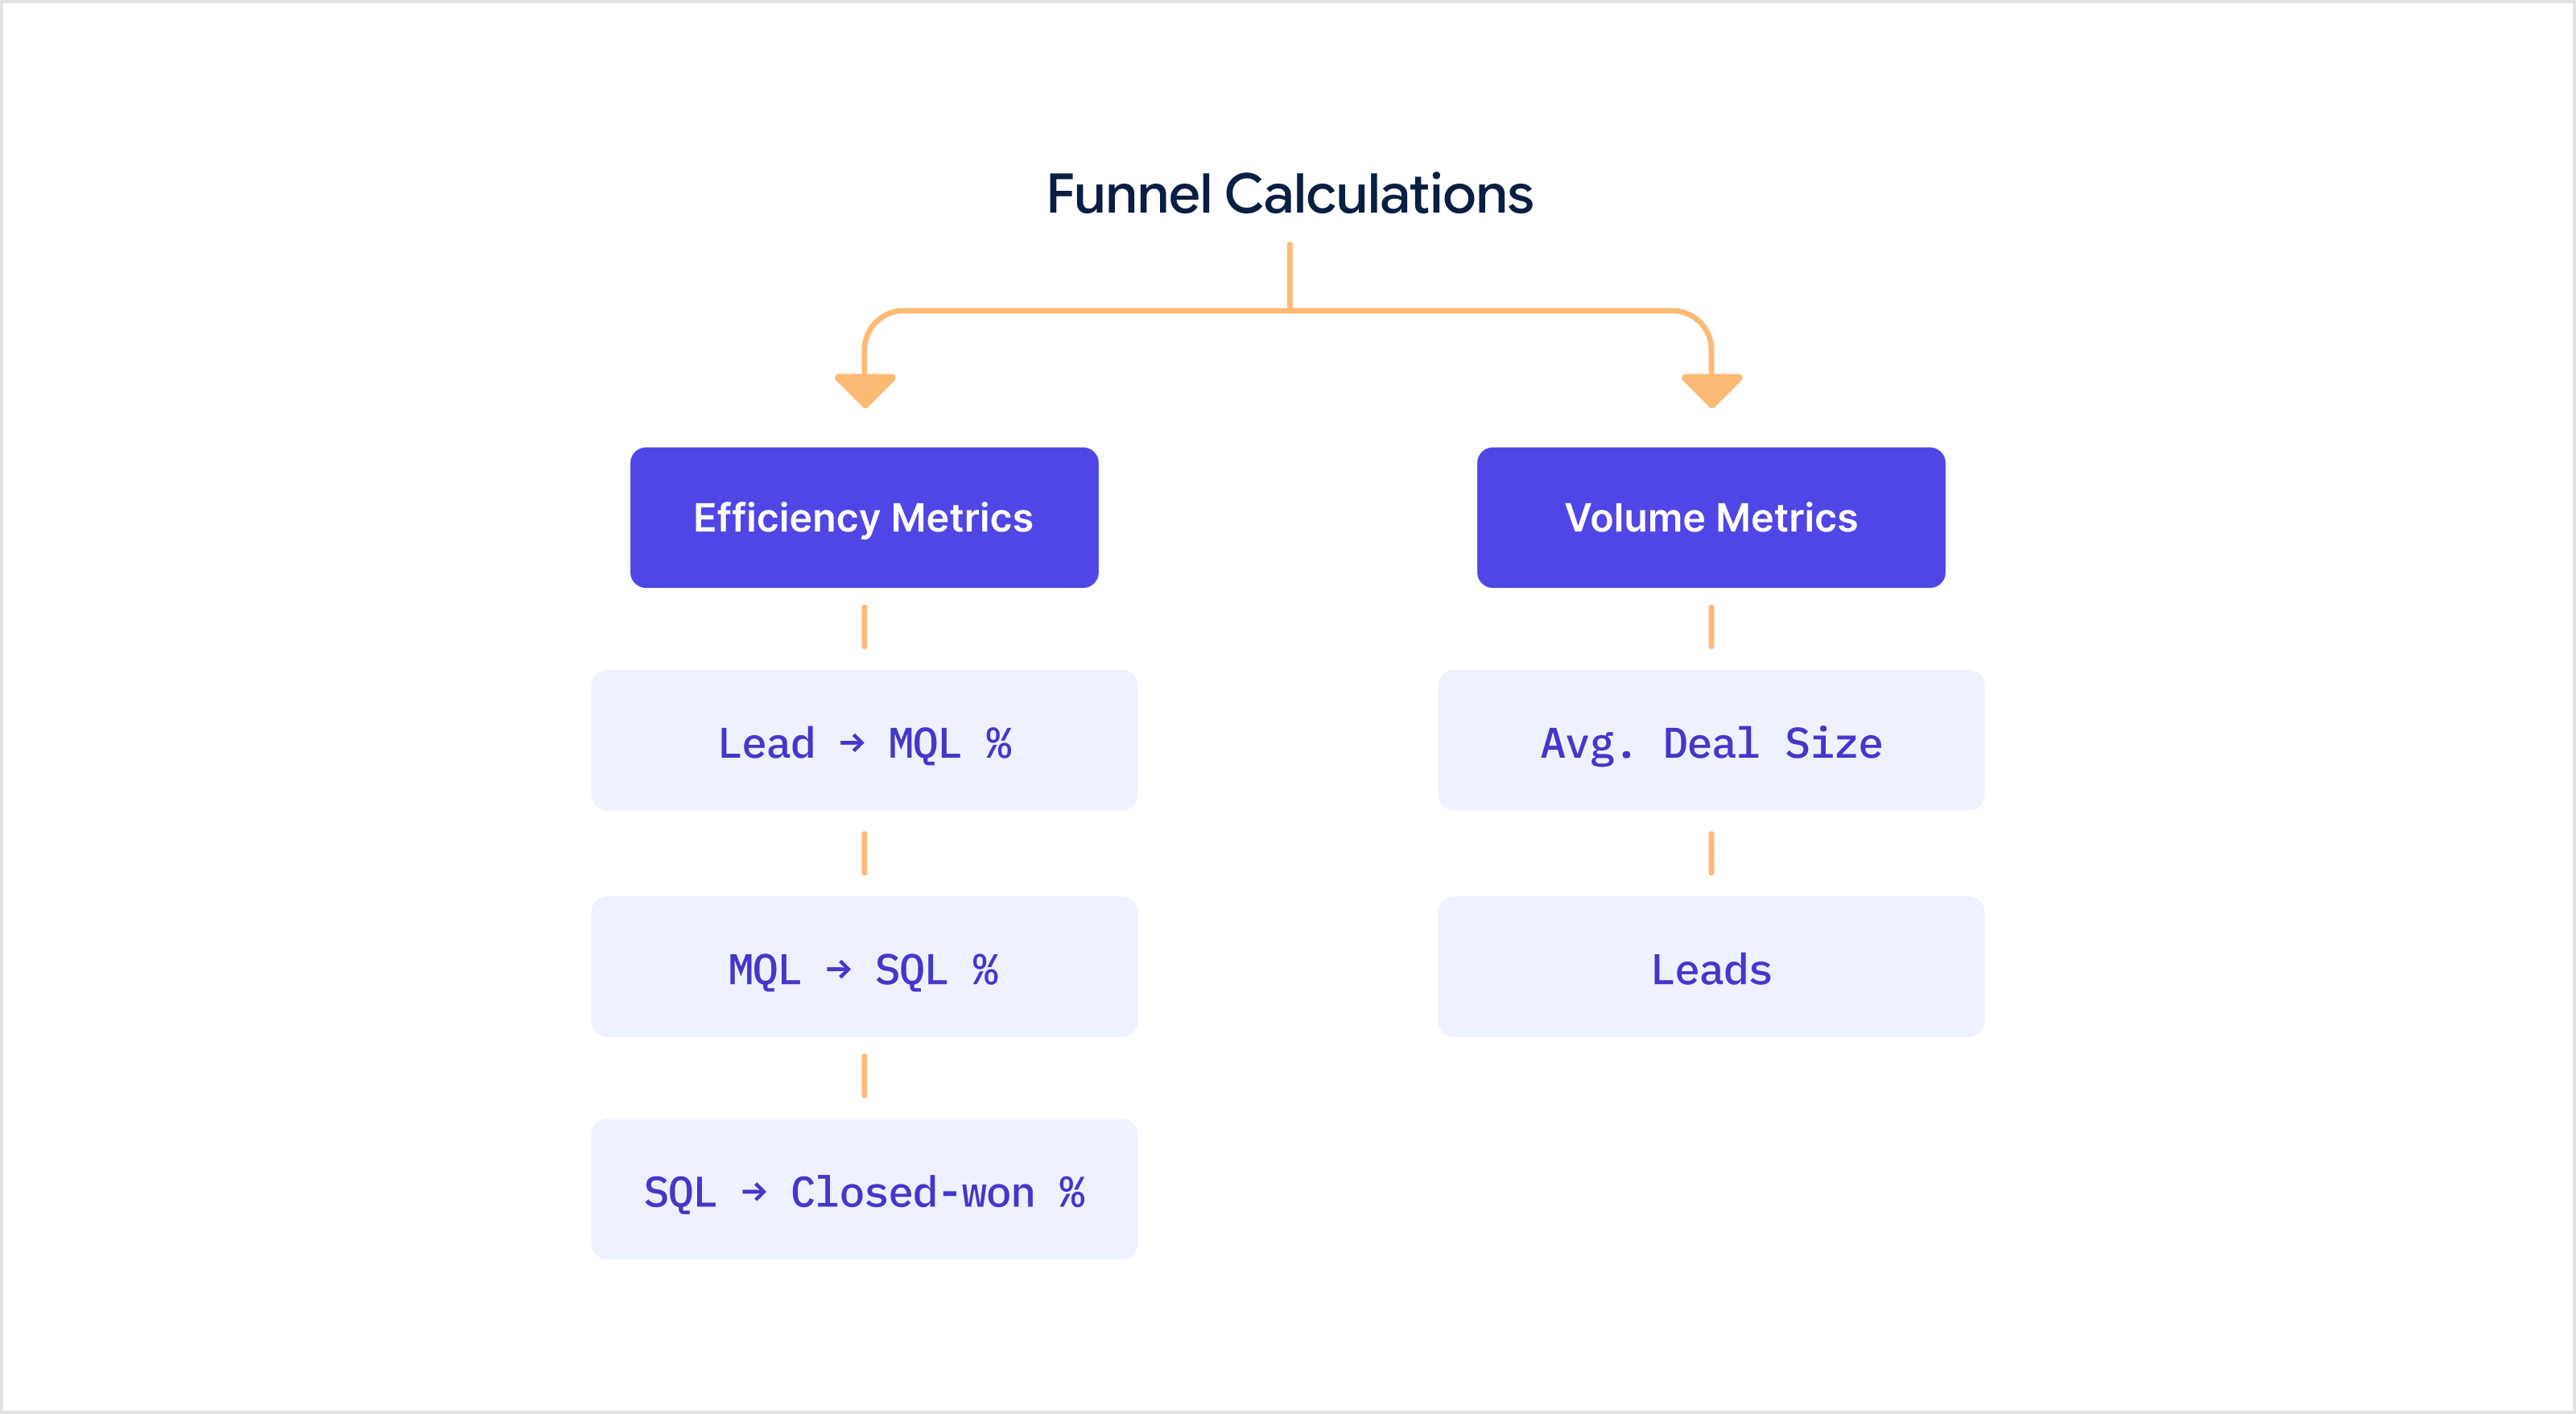
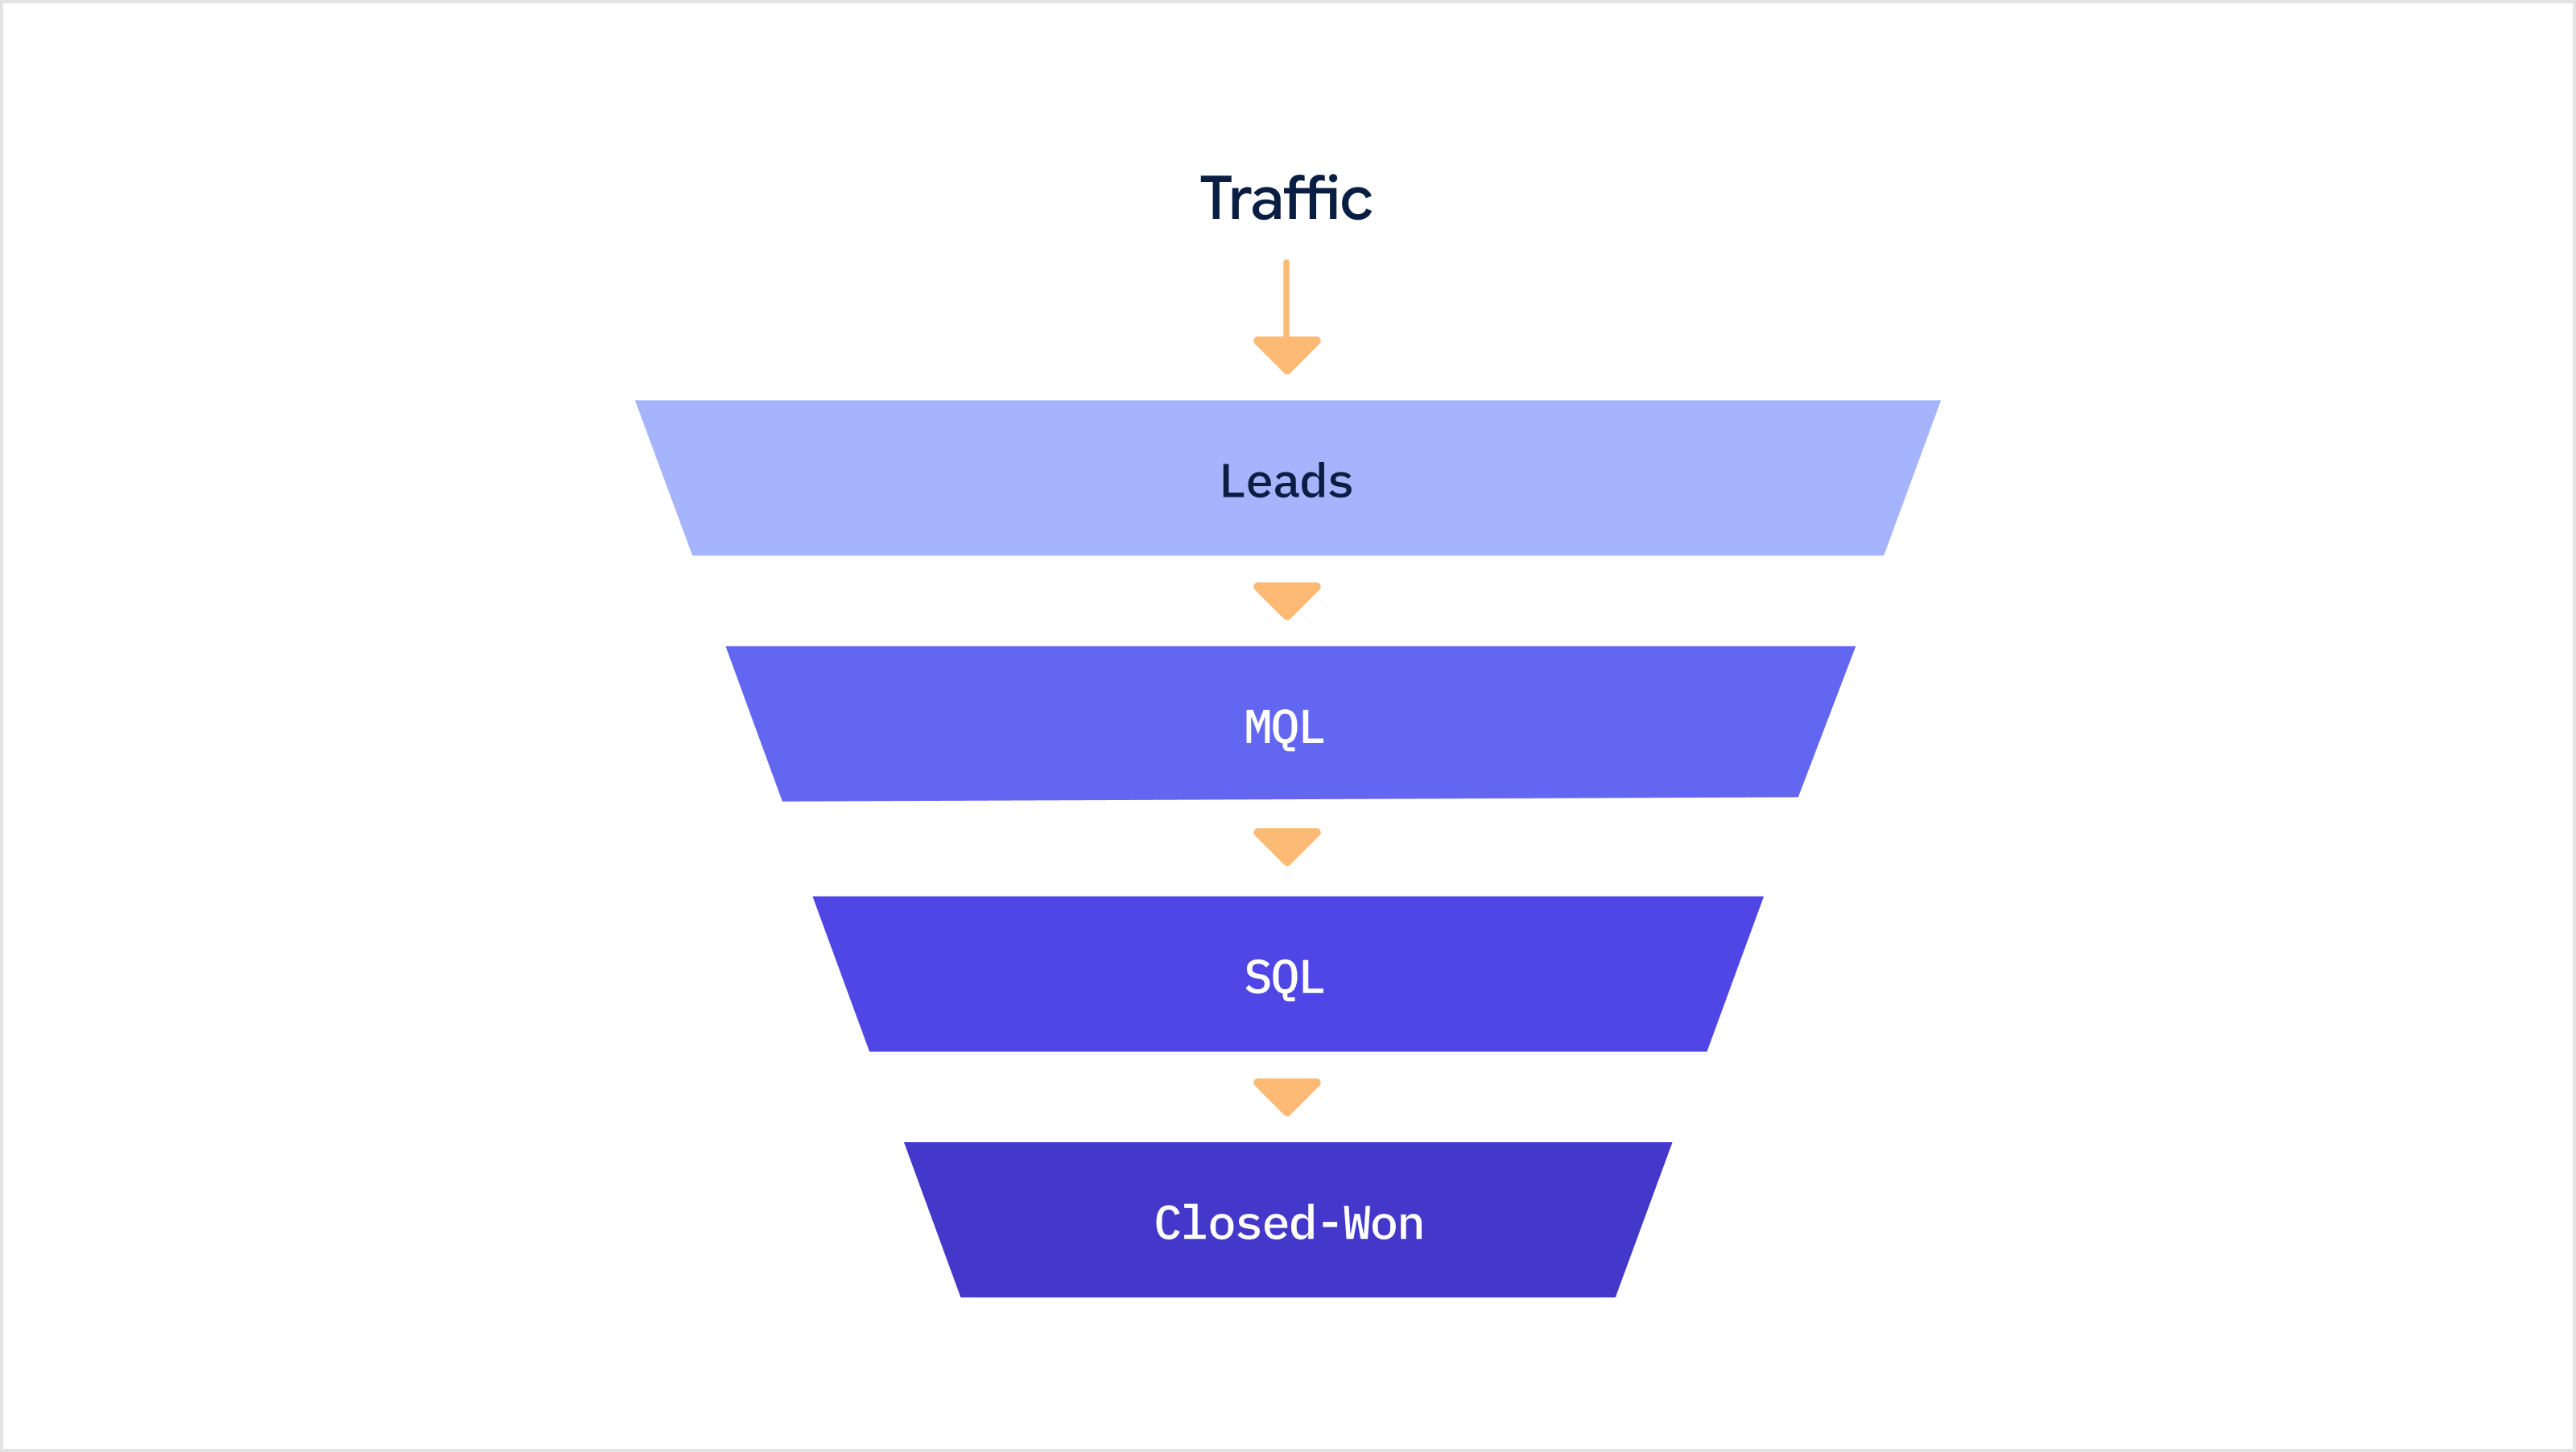
Let’s walk through these calculations using Acme as an example. First, let’s assume Acme’s funnel consists of the stages illustrated in the image below.
Your assumptions are critical when building a model. The base rates (baseline values) you assume have an outsized impact on the model’s results. Here’s a handy guide to estimating base rates that minimize biases and increase model accuracy.
Next, we assume the following base rates for Acme based on historical data to avoid biases:
Enter values by market segment only if those metrics vary significantly across the segments. If the variation is minimal, keep it simple by taking the weighted average.
Next, we determine the volumes we need at every funnel stage to achieve our New ARR target of $21 million annually. We can work backwards from the deepest portion of the funnel, the number of Closed-Won deals.
The number of new Closed-Won deals required to achieve the New ARR target is:
The number of monthly SQLs needed is:
Similarly, the MQL and Lead numbers are:
This works out to 10,500 MQLs and 42,000 leads per fiscal year, or 875 MQLs and 3,500 leads each month.
For simplicity, we have assumed that the deal size and conversion rates remain the same across geographies and market segments. You can incorporate variations into your top-down plan as Deal sizeUS, Deal sizeEU, MQL to SQL rate %US, MQL to SQL rate %EU, and so on.
Now that you know the lead volumes you need to generate, it’s time to create a capacity plan that will get you there.
Step 3 : Calculate and plan capacity
.png)
The first step in creating a capacity plan is figuring out your funnel velocity metrics. These refer to the time it takes to move a prospect from one stage to another. For example, how long does it take you to turn a lead into an MQL or an MQL into an SQL?
We’ve listed the funnel velocity metrics for Acme Inc below.
Acme: A B2B SaaS Company
Acme caters to the mid-market and enterprise segment. They have a 6-month sales cycle. They do fixed 12-month plans.
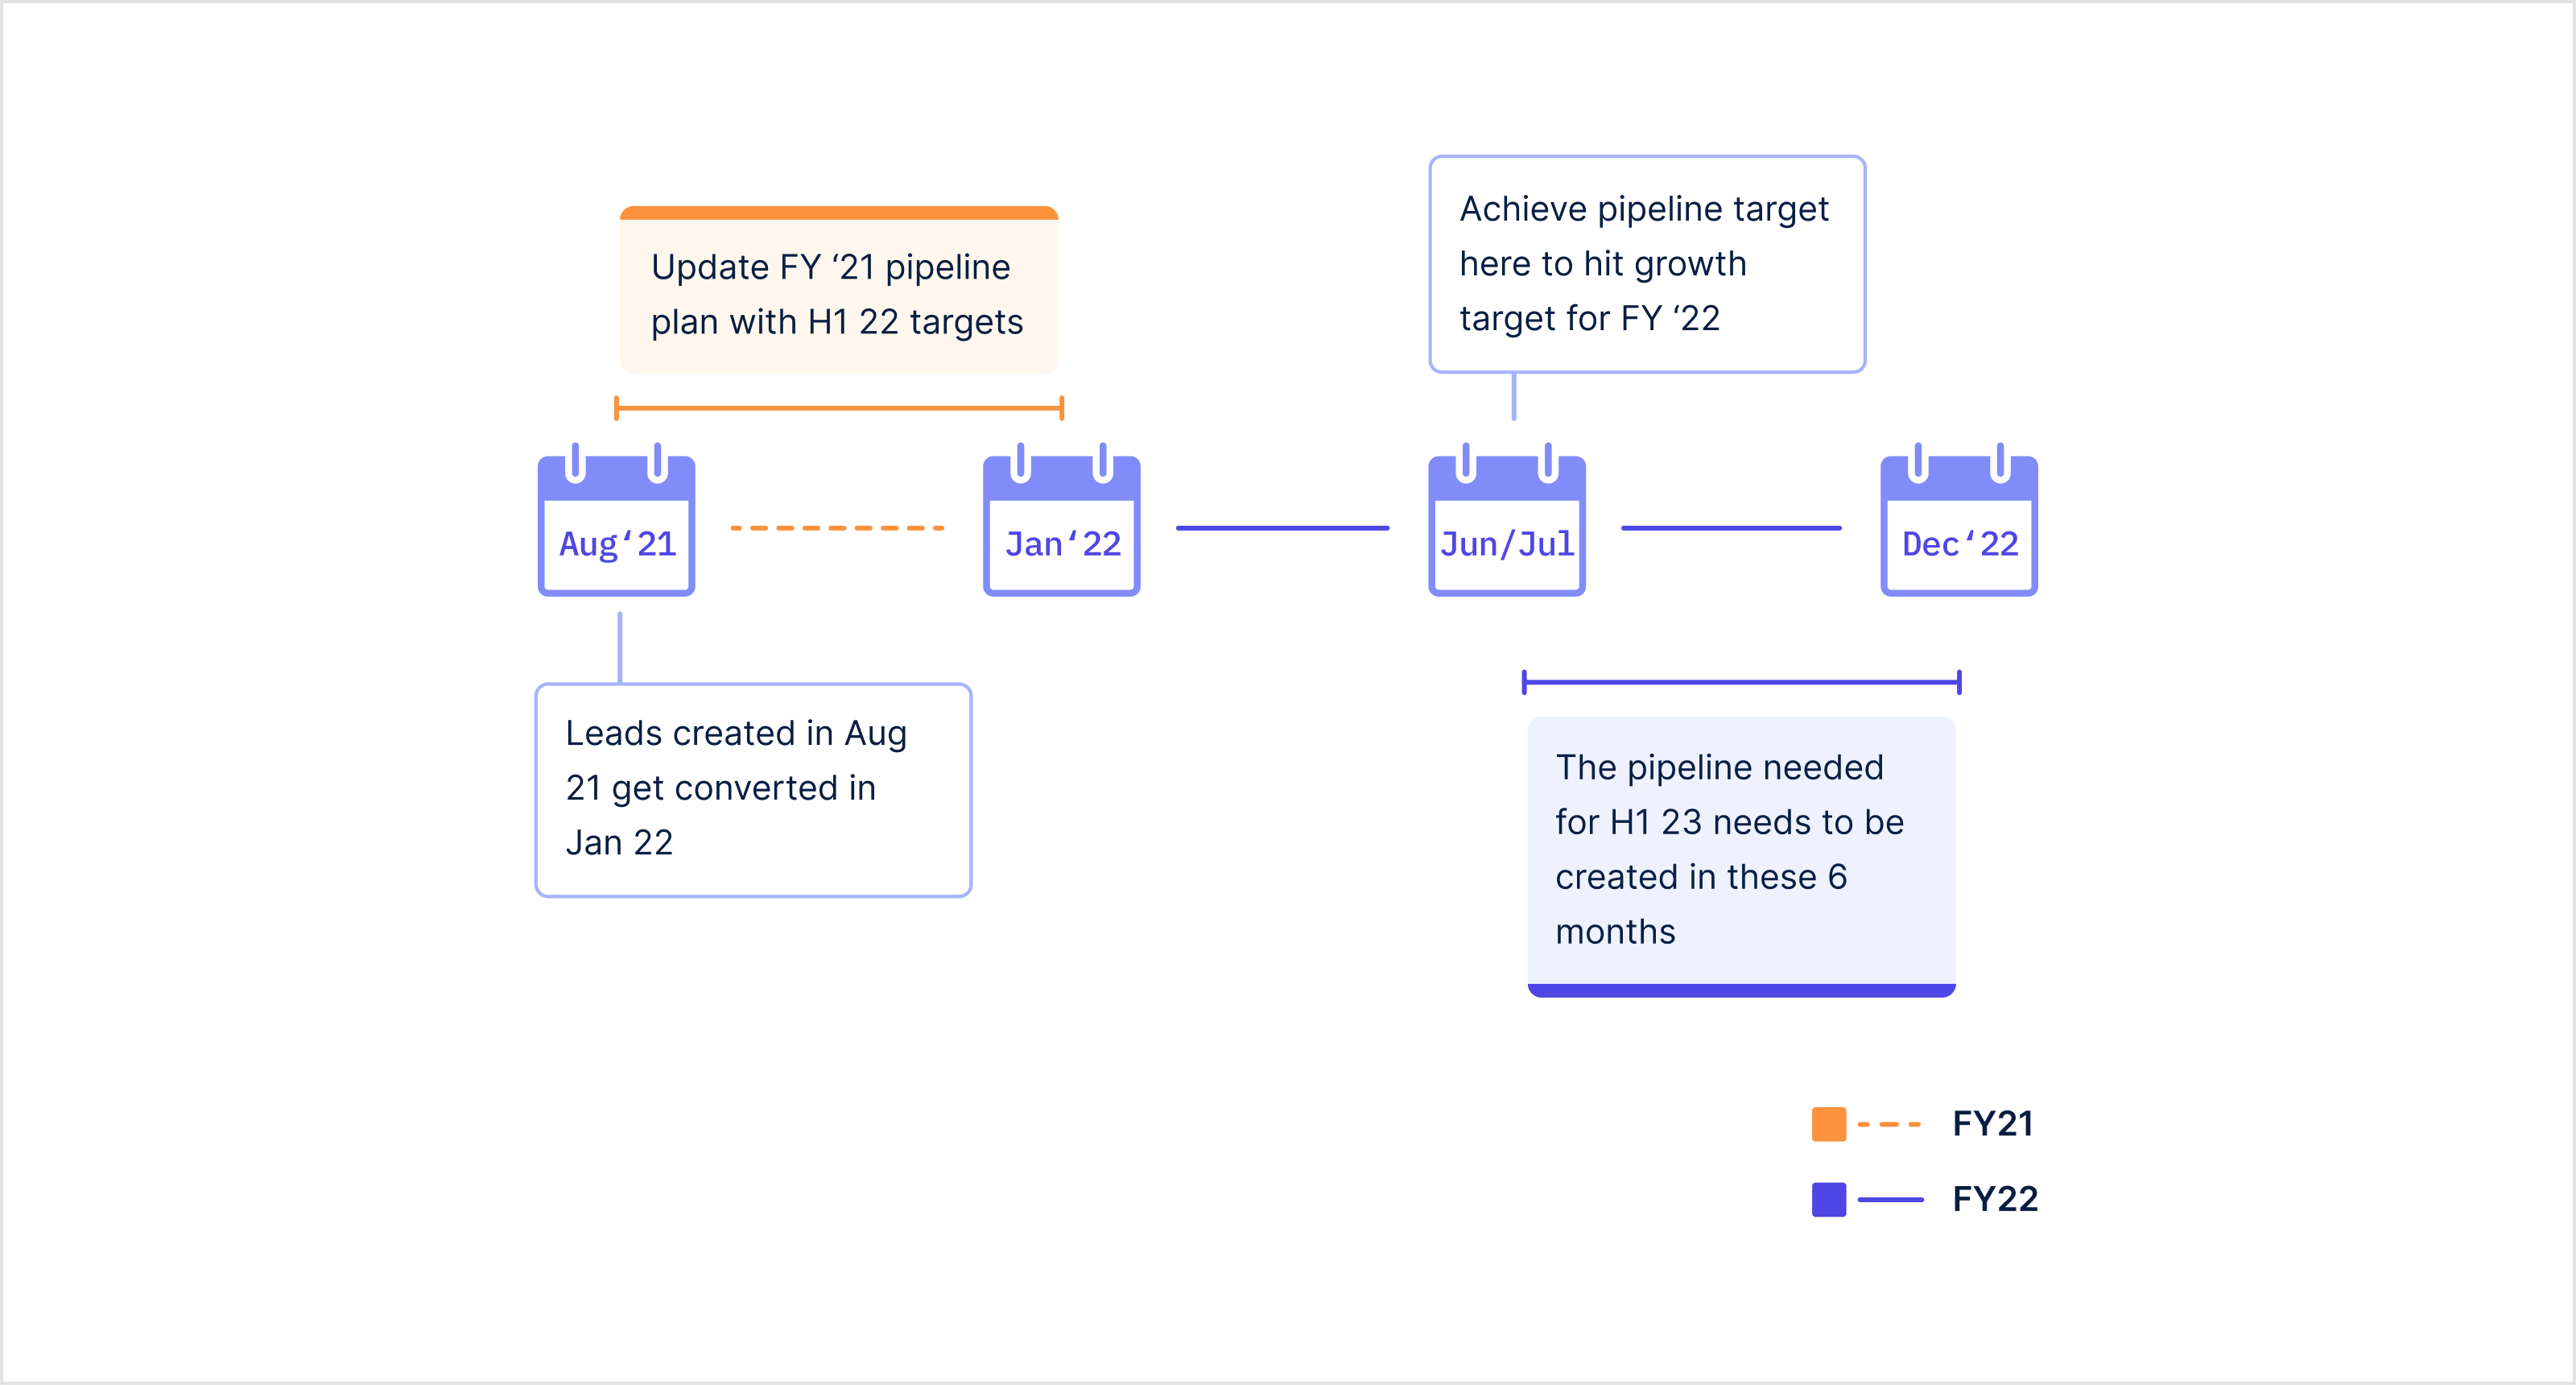
We haven’t factored seasonality into our plan to maintain brevity.
The funnel velocity time dictates how soon Acme must fill its pipeline. In this case, the company must achieve their pipeline volume target within six months. If Acme’s funnel velocity was nine months, the company must fill its pipeline within three months to achieve its target by the end of the fiscal year.
Additionally, you must also account for employee ramp-up times and create a hiring plan accordingly. In Acme’s case, a ramp up time of two months means the company must execute its hiring plans at least two months before the plan is locked in. Given the need to lock in the plan six months before the start of the fiscal year, Acme must begin executing its hiring plan eight months before to ensure it meets its growth targets.
Next, let’s assume that Acme currently has:
10 SDRs - Delivering 20 SQLs each every month per previous assumptions
10 AEs - Delivering 5 Closed-Wons each every month per previous assumptions
Acme is currently achieving 50 Closed-Wons every month (10 AEs * 5 Closed-Wons per AE per month,) but needs to hit 175 per the table above. Thus, the number of AEs Acme must hire is:
Similarly, the number of SDRs Acme must hire is 25. Note that the SDR to AE ratio being 1-to-1 is coincidental. This is due to the assumptions we have made in our model.
Next, we must account for attrition. We’ve assumed an annual rate of 20% previously, giving us the number of AEs and SDRs to be hired as 27 each.
Acme must hire these reps at least two months before the planning period begins, given our assumption that ramp-up time lasts for two months.
Step 4 : Build a safety factor into capacity plans
Not everyone you hire will successfully hit their quota. You can use a damping factor to act as a buffer. This is commonly called the quota attainment rate %. Here is our quota attainment assumption for Acme Inc.
An attainment rate of 80% implies that four out of five new hires will meet their quotas. You must compensate for this potential shortfall by hiring additional resources.
Thus, instead of hiring 27 AEs and 27 SDRs, Acme must hire 34 AEs and 34 BDRs (27 ÷ 80%).
Given the large team size, Acme must also fill management positions (VP or Director). Assuming a 1-to-7 ratio of executives to team members, Acme must hire an additional 10 managers across its SDR and AE teams.
You will experience fluctuations in the sales cycle due to seasonality. However, since we’ve spread pipeline targets evenly, you will achieve your desired targets.
Chart your path to New ARR
The methods described thus far will help you chart a course towards your New ARR. Best of all, you can extend capacity planning calculations to other teams such as marketing, onboarding, customer success, and support to achieve optimal resource allocations.
Make sure you verify whether your business can afford to focus on New ARR before diving into resource planning. If your business is in the right position, begin by examining funnel velocity and determine your resource needs from there. Build a safety factor into capacity planning as we’ve described, and you’ll have a timeline and resource plan to help you hit your revenue growth targets.
Curious about how you can optimally deploy the methods shared here? Reach us at learn@drivetrain.ai or schedule a free demo.
About Drivetrain
A fast-growing SaaS business can benefit from a purpose-built tool that simplifies and accelerates the planning process. Drivetrain’s collaborative and connected planning solution ties your business plans, budgets, and forecasts to your strategic objectives and operational targets set by the board—including your New ARR goals.
Our single, unified platform ensures data integrity for all business processes, including planning, budgeting and forecasting. For instance, you can model a top-down allocation that automatically spreads high-level targets across multiple nested dimensions such as products, market segments, regions, and more. You can even account for values based on seasonal and historical patterns, allowing commentary at any level of detail.
.png)
Kirk Kappelhoff is a financial modeling expert with a BBA in Finance & Accounting and nearly a decade of experience at Deloitte, EY, and KPMG, where he built models for pre-IPO companies, M&A transactions, and strategic planning initiatives. At KPMG, he led the Business Modeling Services team, specializing in equity stories and financial forecasts that help high-growth companies communicate their value to investors. At Drivetrain, Kirk writes about strategic planning, granular reporting, and modern FP&A best practices for rapidly scaling finance teams.
.png)
.png)
.png)
.png)


.svg)