.svg)

Bowtie metrics tell you how well you’re doing across all stages of the bowtie model (or your customer journey). But make no mistake. Effectively tracking bowtie metrics requires a well-structured strategy to consolidate, normalize, and analyze data. If you’re scaling a recurring revenue business with the bowtie model and want to track progress, this guide is for you.
This article is the latest in our SaaS bowtie funnel series, where you can learn:
- Why smart SaaS leaders are adopting the bowtie model
- How to adapt the bowtie model to any GTM strategy to find hidden growth levers
- How to build the data structure needed to your bowtie model
Here, we’ll take a deeper dive on the different types of metrics you need to track and understand to effectively leverage your bowtie model and boost recurring revenue.
Essential metrics to track in the bowtie model
The Bowtie model uses a series of conversion subsystems to indicate when a prospect has progressed from one stage in the funnel, which can be used as metrics to track the bowtie model’s performance at each stage.
The specific metrics will depend on the type of go to market (GTM) strategy you’re using, and defining them is a critical first step in building out your bowtie model. Winning By Design offers a standardized bowtie model that provides an excellent starting point for this.
Here, we’ll dig into the different categories of bowtie metrics you can use in building your bowtie model and provide examples of how to use them to measure its performance across every stage in the customer journey.
Volume metrics
Volume metrics measure how many and how much. For example, they might measure how many leads entered the funnel in the awareness stage or how much revenue was committed when the deal was closed-won and the prospect became a paying customer.
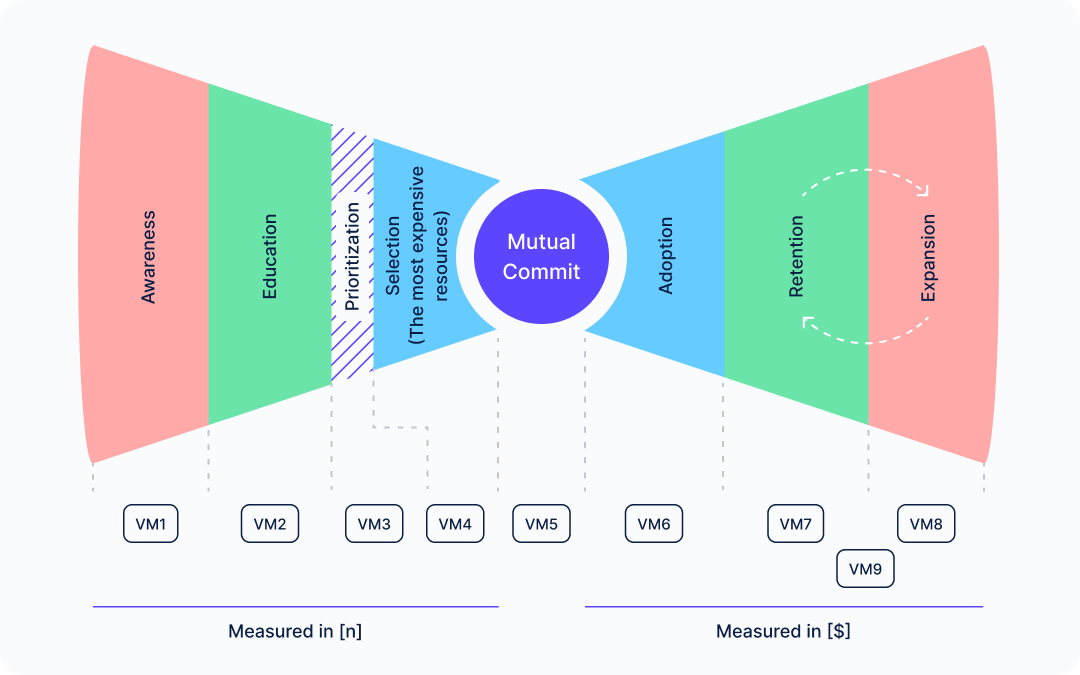
The figure above illustrates the conversion subsystems at each stage of the bowtie funnel (VM1, VM2…VM[n]). On the left side of the funnel, volume metrics would be used to measure the number of prospects that move through each stage in the sales process from awareness to becoming a customer (VM1 to VM5). You can also define a volume metric within the selection stage (VM4) that captures the number of prospects who have signaled a greater likelihood of converting into a customer (e.g., signing up for a demo).
On the right side of the model, after the deal is closed, volume metrics would measure the amount of revenue coming from each stage from adoption to retention and ultimately expansion (VM6-VM8). Ideally, retention and expansion would become cyclical, continually growing renewal ARR with successive renewals and expansion ARR over time until the customer eventually churns (VM9).
When you build your model, it’s important to clearly define each metric. It’s also useful to use a standard naming convention for them, such as VM1, VM2…VM[n], to avoid confusing them with other types of metrics you track, such as conversion metrics, and velocity/time metrics.
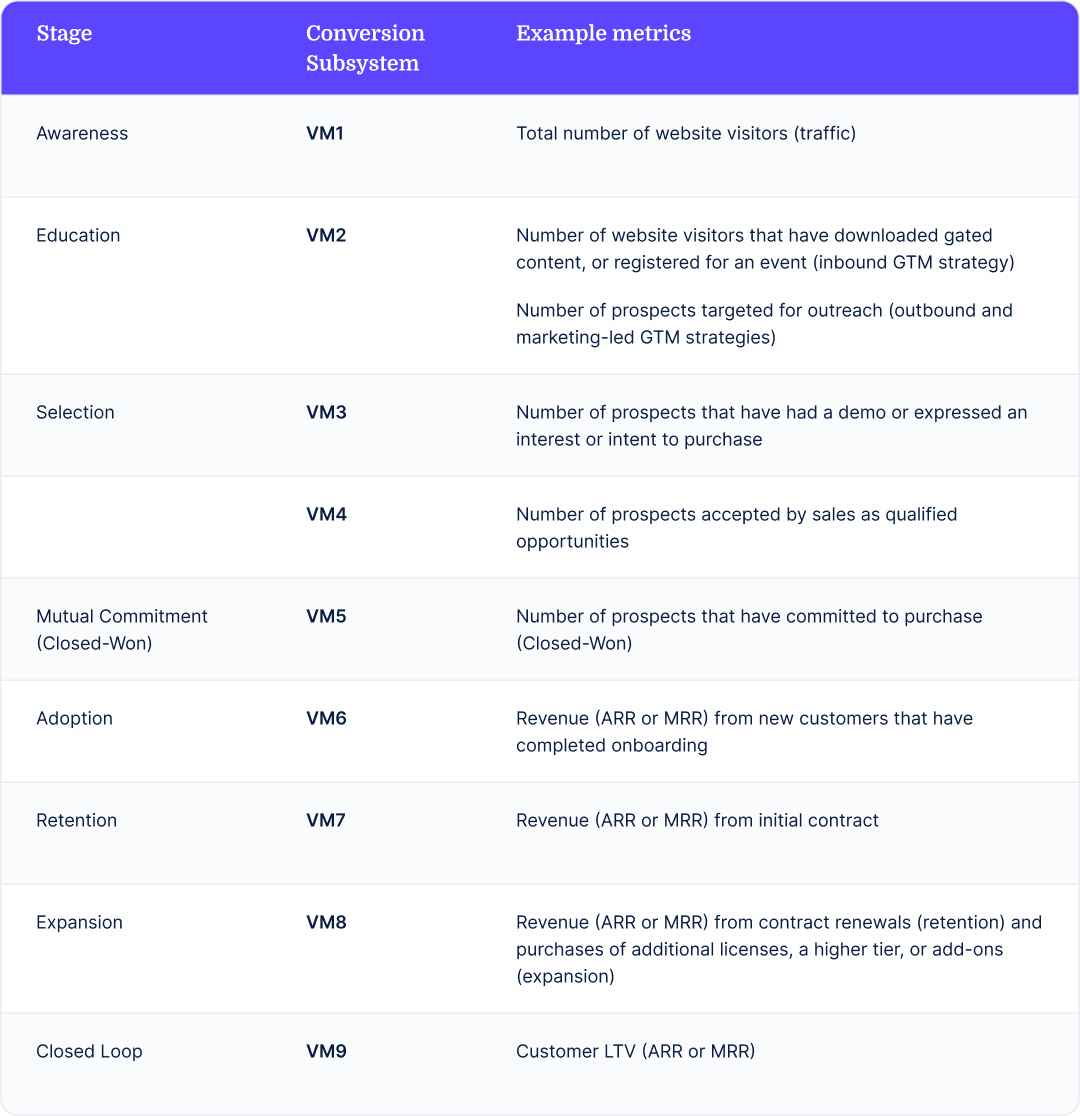
The table below provides examples of volume metrics commonly used in SaaS bowtie funnels. Some are broadly applicable to any GTM strategy while others are more applicable to a specific kind of strategy (e.g., inbound vs. outbound). If you’re building out bowtie models for different GTM strategies, make sure to use a different name for each uniquely defined metric so that you clearly know what data you need to track.
One of the advantages of the bowtie model is that it’s highly customizable. You can define volume metrics in any way that accurately reflects the customer journey for your business.
It’s important to note that volume metrics aren’t about interpreting performance directly. They simply capture the numbers without any context. However, they are integral to the bowtie model because once you have these numbers, you can begin asking questions about conversion and then speed.
Conversion metrics
Conversion metrics measure the efficiency with which your customers’ journey progresses between stages of the bowtie funnel.
Conversion metrics illustrate why volume metrics are necessary: While volume metrics measure how many leads or deals exist at each stage, conversion metrics tell you the percentage of these that move on to the next stage.
For example, if you close 10 deals out of 40 qualified opportunities, your conversion rate from qualified to closed is 25%. Obviously, you can’t calculate the conversion percentage without the number of qualified opportunities and the number of deals closed. But more importantly, the percentage speaks to the performance of your sales team (or possibly other factors influencing conversion), something a volume metric alone can’t tell you.
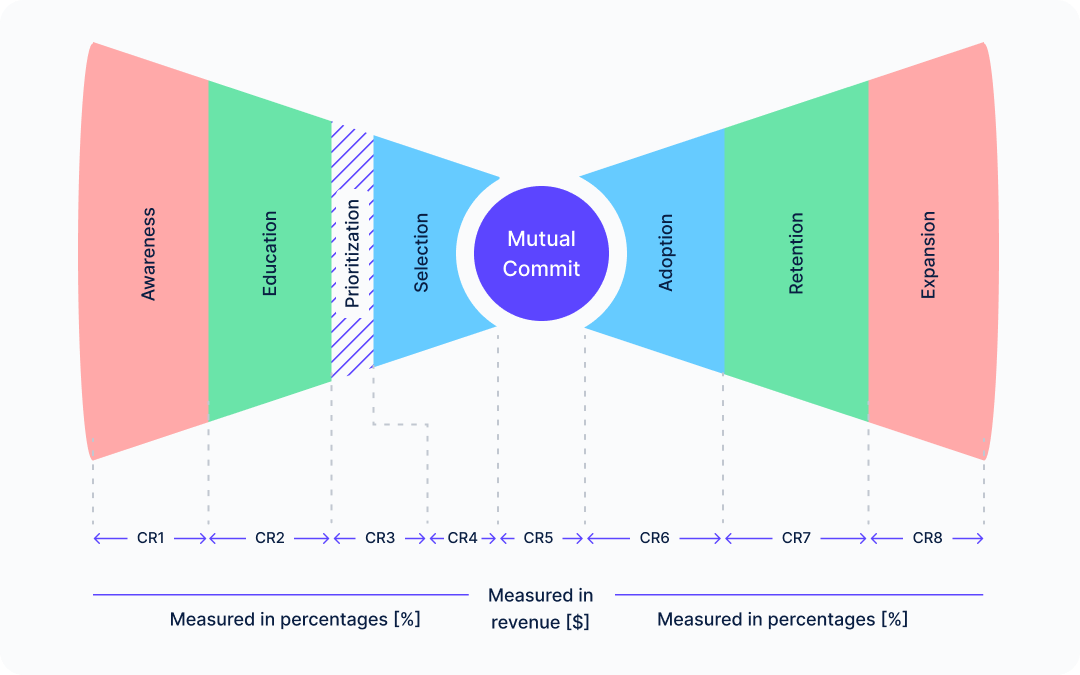
The table below provides examples of conversion metrics common to SaaS bowtie funnels. Using the naming convention As with volume metrics, these are customizable based on your unique process pre- and post-sale processes. Likewise, using a similar naming convention, such as CR1, CR2…CR[n], will help you avoid confusion with other types of metrics you track.
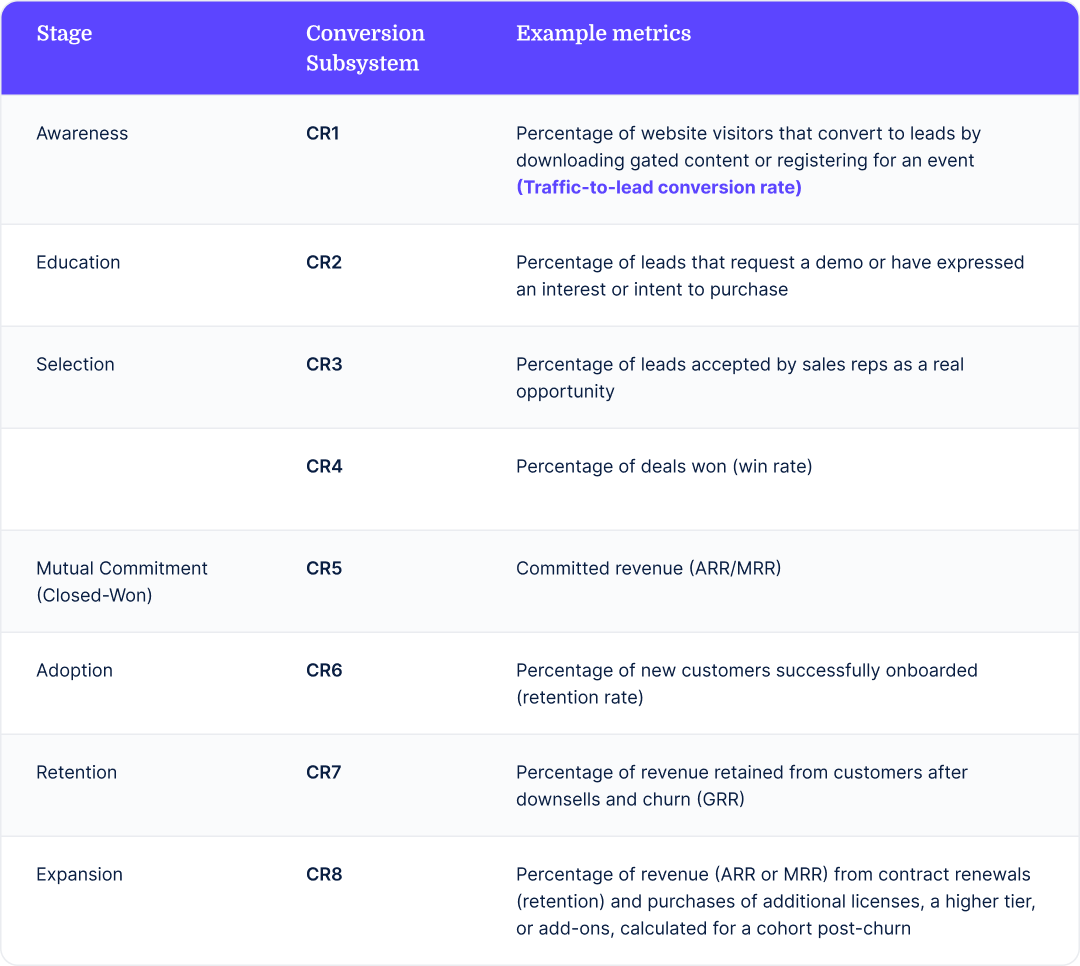
If you look closely at the table, you’ll notice that almost all CR metrics measure outputs as a percentage, which relies on volume metrics, more specifically, those on both sides of the conversion.
For example, if CR1 measures your traffic-to-lead conversion rate, the inputs would be the number of website visitors that convert to leads by downloading gated content or registering for an event (V2 in the volume metrics table) divided by the total number of website visitors (V1). Here’s the math: CR1 = VM2 / VM1.
Velocity or time metrics
Velocity or time metrics measure how long it takes for volume to move from one stage to the next in the bowtie model.
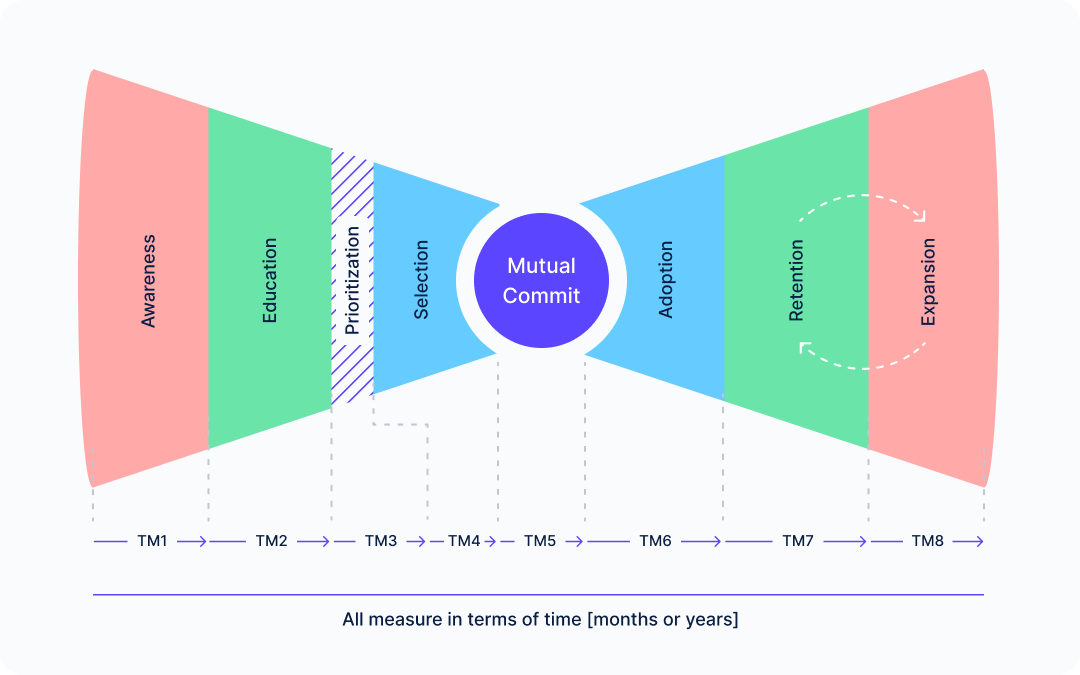
Unlike volume (raw counts) or conversion (ratios), velocity metrics focus on how quickly leads become opportunities or how quickly customers onboard or expand. Understanding these timings helps you find bottlenecks and optimize the customer journey.
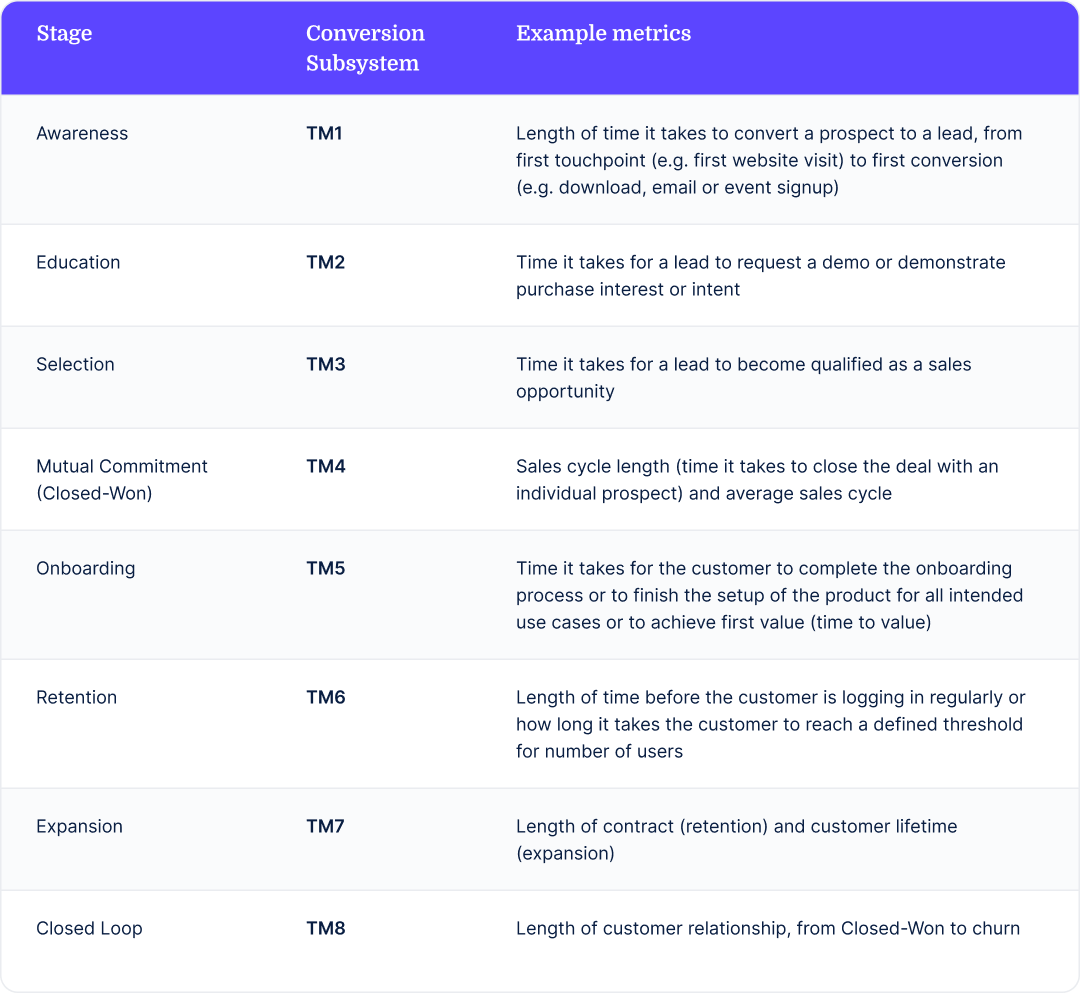
Here’s a standardized way to measure velocity and time across the different stages in your bowtie model. While broadly applicable to most SaaS businesses, these metrics can be tailored to fit your business’ customer journey.
Importance of measuring conversion events in different ways
It's important to start with a definition and a clarification: Conversion events are not the same thing as conversion metrics. Conversion events describe an action prospects take that signals their move from one stage to the next. Conversion metrics are a measurement—a percentage of prospects that convert from one stage to another. All bowtie metrics use conversion events. They just measure them in different ways, by raw numbers (volume metrics), percentages (conversion metrics), or the time it takes to move to the next stage (time or velocity metrics).
Conversion events—the signals that tell you a customer has moved to the next stage in the customer journey—help connect customer behavior to business outcomes. Tracking how customers move from one stage to the next gives your revenue team the information needed to optimize the customer lifecycle, from first contact to revenue and expansion. That’s why measuring these events in the form of volume, percentages, and timing is critical for healthy revenue growth.
Below, we break down this importance into four key points:
- Help set reasonable goals: Conversion events, when measured in a quantitative way, help establish a baseline for performance by showing how your team is performing based on historical data compared to others in the industry. This baseline helps you set realistic targets at each stage of the customer journey.
- Reveal bottlenecks and opportunities: Conversion events reveal friction points in the customer’s journey. This tells your team where to dig deeper, find the cause, and fix it to improve conversions. For example, if leads are moving to discovery calls at a healthy rate, but only a small percentage are progressing to the proposal stage, the conversion rate from discovery to mutual commitment is lagging. Once this drop-off is isolated, your team can investigate, find the root cause, and take targeted action.
- Acquisition and retention metrics analysis: Tracking customer metrics reveals whether you’re acquiring the right type of customers (the ones who stick around and grow). Churn is often a sign of poor fit, and if that’s the case with you, fix it, and you’ll see your customer acquisition cost (CAC) drop and lifetime value (LTV) increase.
- Foster sales and finance collaboration: Conversion events directly impact financial KPIs like annual recurring revenue (ARR), CAC, LTV, and CAC payback periods. Visibility into conversion enables the finance team to collaborate with sales on forecasting and budgeting. Their department also uses conversion data to set targets and calculate ROI on GTM investments.
How to measure and track these core metrics in the bowtie model
To measure and track metrics, you need to define clear conversion points at every stage of the customer journey. Let’s look at a quick step-by-step that will help you get started:
Map the entire customer journey
Before you measure any metric, you need an end-to-end map of your customer’s journey. Break down the customer journey into clearly defined stages across sales, marketing, and post-sales. The bowtie model divides this journey into two halves:
- Left side: This is the pre-sale journey. Define each stage based on buyer intent and observable actions (like demo requests). This is the side where you’ll measure how effectively you’re converting interest into revenue.
- Right side: The right side represents the post-sale journey. Map each stage on the right side of the funnel to measure how well you’re retaining and expanding your customer base.
Define clear conversion events for each stage and how they will be measured
Each stage should have at lest one clearly observable conversion event. This event could be the customer booking a demo, inviting 3+ team members, renewing their contract, or something else, depending on how you’ve designed the customer journey.
Avoid ambiguity when defining conversion events. For example, moving from VM2 to VM3 might require ICP qualification and a discovery call instead of just engagement. Map these conversion events to relevant funnel stages, and that’s your foundation for tracking and calculating your key metrics.
Gather and analyze data for each stage
Configure your systems (product analytics, CRM, CS, and others) to track entry and exit for every lifecycle change. This includes tracking signals like opening emails or hitting key product milestones (completing first login, using multiple features, participating in a case study, etc.).
Once you have this data, use it to measure how many people move forward (conversion rates) and how long they stay stuck at each step (time-in-stage). Look for stages where people drop off and break the information down by customer type, industry, acquisition channel, or other relevant parameters to spot patterns.
Implement cohort analysis
Add context to conversion rates by looking at how different groups of customers behave over time. Group users by when they entered a stage (like when they started a free trial) and track how many moved forward.
This shows the speed of the customer’s progress through the journey. It also helps spot patterns. For example, maybe a new sales strategy improved early conversions but didn’t impact long-term retention.
Align cross-functional teams
Tracking conversion events and the associated metrics only works when sales, marketing, product, and customer success agree on what each stage means, what success looks like, and who’s responsible for what.
Whenever you review pipeline, churn (or metrics), or upsell performance, use the bowtie model as a shared framework. Make sure each team owns specific stages of the bowtie journey. This helps direct everyone toward your common goals.
Leveraging the insights for growth
Now that you’ve measured performance across the bowtie, it’s time to apply that information and make wise decisions. Here are a few ways to optimize the bowtie funnel based on the metrics you see.
Optimizing the acquisition engine
Acquisition strategies require constant fine-tuning based on conversion insights from the left side of the bowtie. Here are some ways to optimize acquisition:
- Refining ICP and lead scoring: Identify which types of leads are more likely to convert and stick around using historical conversion data. Then adjust your ideal customer profile (ICP) and lead scoring model to prioritize quality over quantity.
- Improving sales enablement and training: If you notice certain reps or segments convert better than others, dig deeper. Use these insights to train the rest of the team and update your playbook.
- A/B testing messaging and sales processes: It’s always better to test than guess. Use controlled experiments to see what actually improves conversion at each stage with A/B tests and optimize as you go.
Strengthening the retention loop
Let’s now move over to the right side of the bowtie. Conversion metricsand their associated metrics on this side help you retain and grow your customer base. To strengthen your retention loop:
- Improve customer success programs: Track where customers drop off during onboarding or adoption. Use this data to make changes in your CS playbooks and improve time-to-value.
- Proactively predict and minimize churn: Monitor conversion metrics for early warning signals like low usage and delayed onboarding. Set up alerts and intervene proactively to drive adoption.
- Identify and double down on expansion opportunities: Spot patterns to fuel expansion. For example, analyze conversion data to find customer segments that upgrade the fastest or use cases that lead to upsells and double down on them.
Enabling data-driven decision making
To achieve and sustain growth based on data-backed insights:
- Regular review performance: Discuss conversion data during weekly and monthly performance reviews. Try to stay ahead of issues and find opportunities by discussing trends with your team.
- Establish clear KPIs and benchmarks: Set goals based on real funnel data. Make sure all teams are aligned on which direction to row in to achieve the targets set for each metric.
It's all in the data
Measuring these metrics isn’t too difficult, but collecting and organizing the data required for measurement is. You need to aggregate data from multiple sources, like your marketing automation system, CRM, and other tools in your tech stack. Then, you need to normalize the data without compromising accuracy.
The rest of the task is simple using a tool like Drivetrain. With Drivetrain, you can measure and track conversion metrics and forecast revenue in real time. Once integrated with other systems, Drivetrain can pull real-time data and update metrics and forecasts. If you’re looking for more insights on Drivetrain before signing up, check out how it compares to other FP&A tools.
Frequently asked questions
The bowtie model tracks both pre- and post-sale stages of the customer journey, which means it can help you spot early warning signs of churn (like slow adoption and failed onboarding) and identify which customers are most likely to upgrade. This helps your team proactively prevent churn and optimize upselling efforts to improve retention and increase lifetime value.
Yes. Conversion and time metrics reveal inefficiencies in your acquisition process. For example, they may help you spot low demo-to-win rates or slow sales cycles. This gives you more clarity on narrowing down your ICP further and optimizing sales execution, helping you reduce CAC.
Yes, as long as you standardize stages and track conversions consistently. For example, a freemium user (PLG) who becomes a product-qualified lead can be converted to a sales-qualified opportunity (SLG). You can track both transitions using volume, conversion rate, and velocity metrics for a unified view across teams.


.webp)


