

Recently, we introduced a great new feature in Drivetrain called Pivot to help our users build out more robust views of their data with configuration capabilities to make data visualization more flexible than ever.
Now, with our new Multi-Select feature, users can drill down into the views they create with Pivot to take their analysis even further! Multi-select allows users to selectively compare any number of elements within the dimensions they’ve chosen.
Drivetrain’s Multi-Select feature is intelligent, too. Any aggregations and calculations you have set up for that view will intuitively change in response to the changes you make in your selections.
Let’s look at an example using some dimensions as page filters…
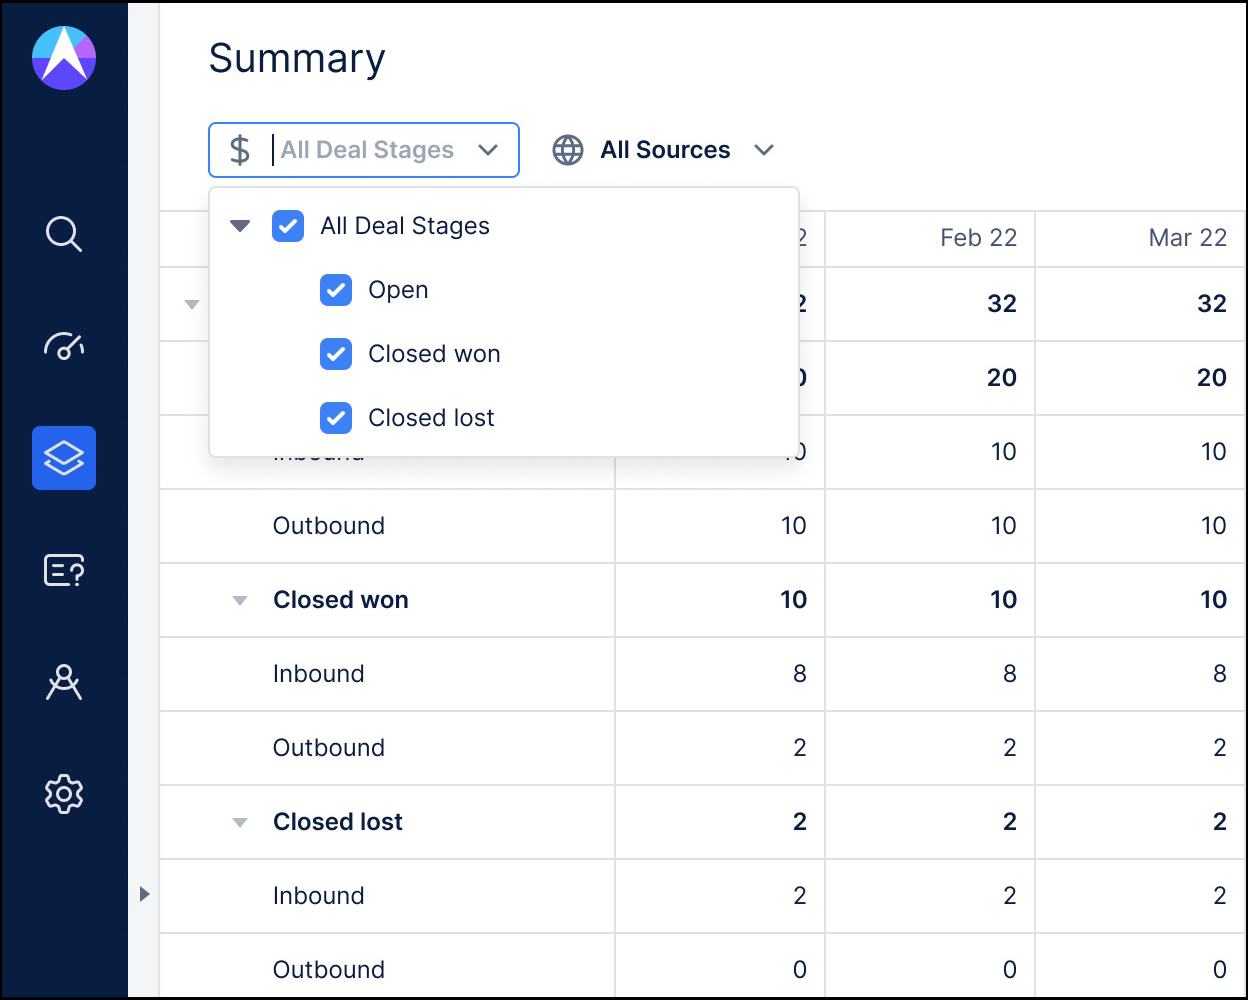
When you open a view you’ve created in Drivetrain, by default, all the different dimensions you’ve included in that view appear automatically. In the example screenshot below, you have three different deal stages.
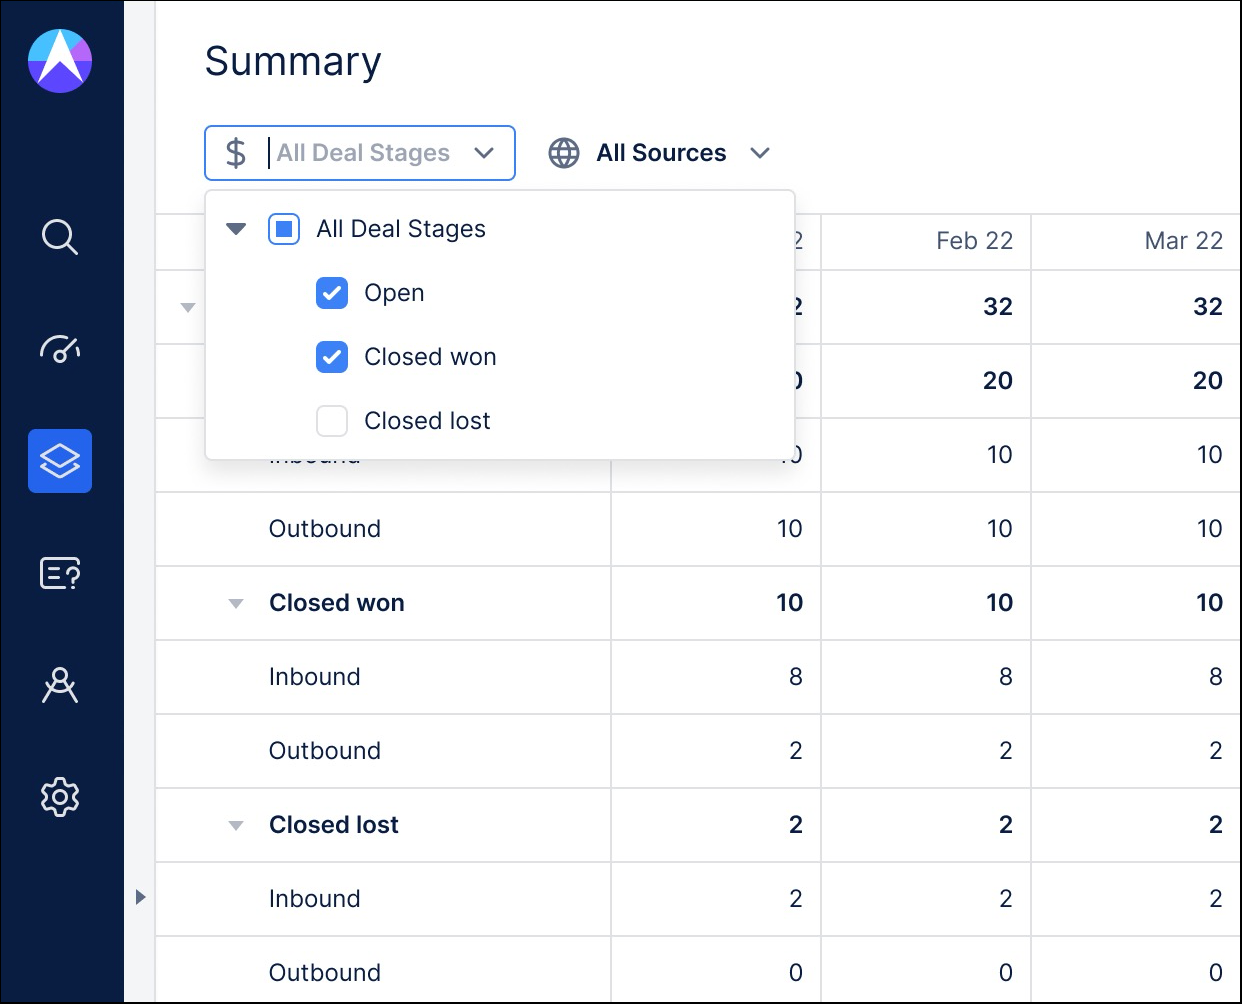
So, let’s say you want to compare how many deals you’ve closed with how many you still have open. With Multi-Select, you simply uncheck the “Closed lost” box.
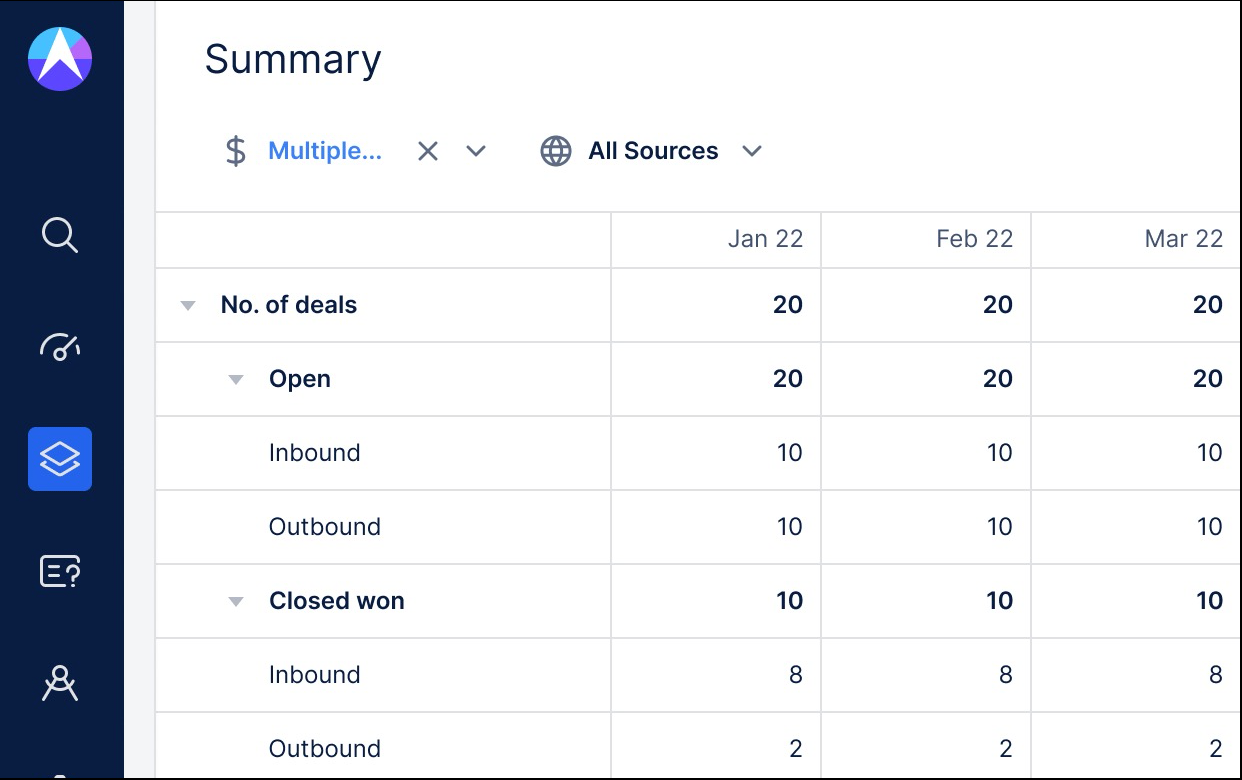
And, the view automatically recalculates the number of deals in your pipeline based on open and closed and allows you to drill into the data even further to see how many came from inbound and outbound leads.
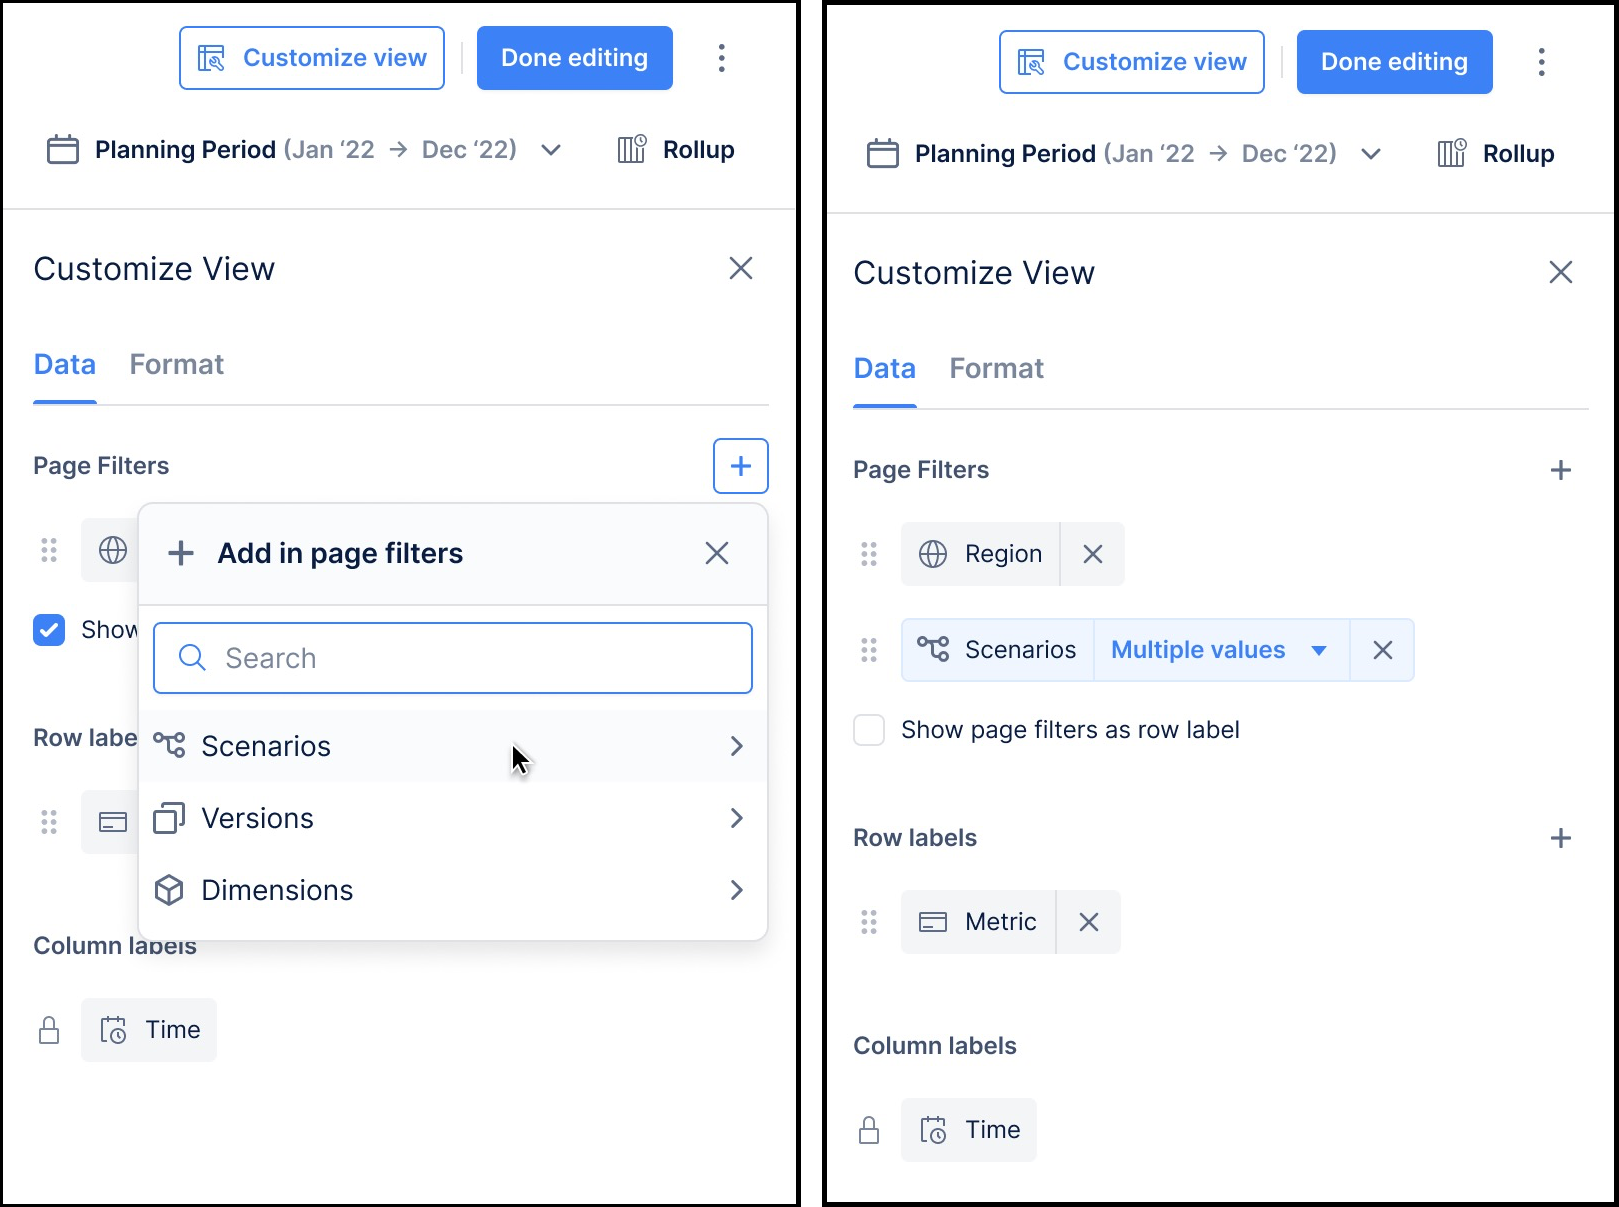
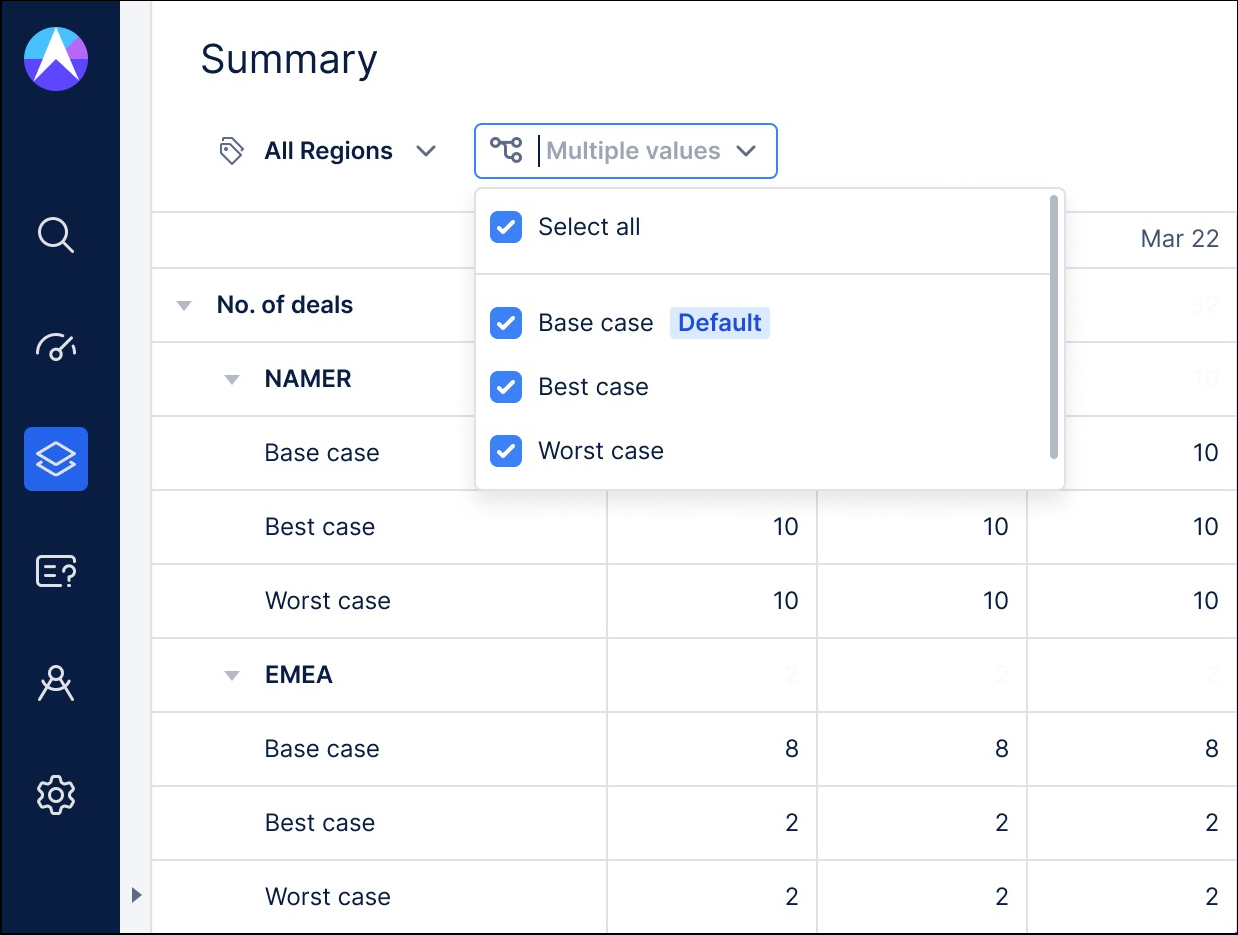
Multi-Select works even better if you have added Scenarios/Versions as page filters. In the example below, we’ve chosen to use Scenarios. In order to make the dimensions multi-select, we have checked the box to show the page filter as rows.
When we look at our data, all the values for our filter are selected by default. But with Multi-Select, we can now pick and choose which of these values we want to compare.
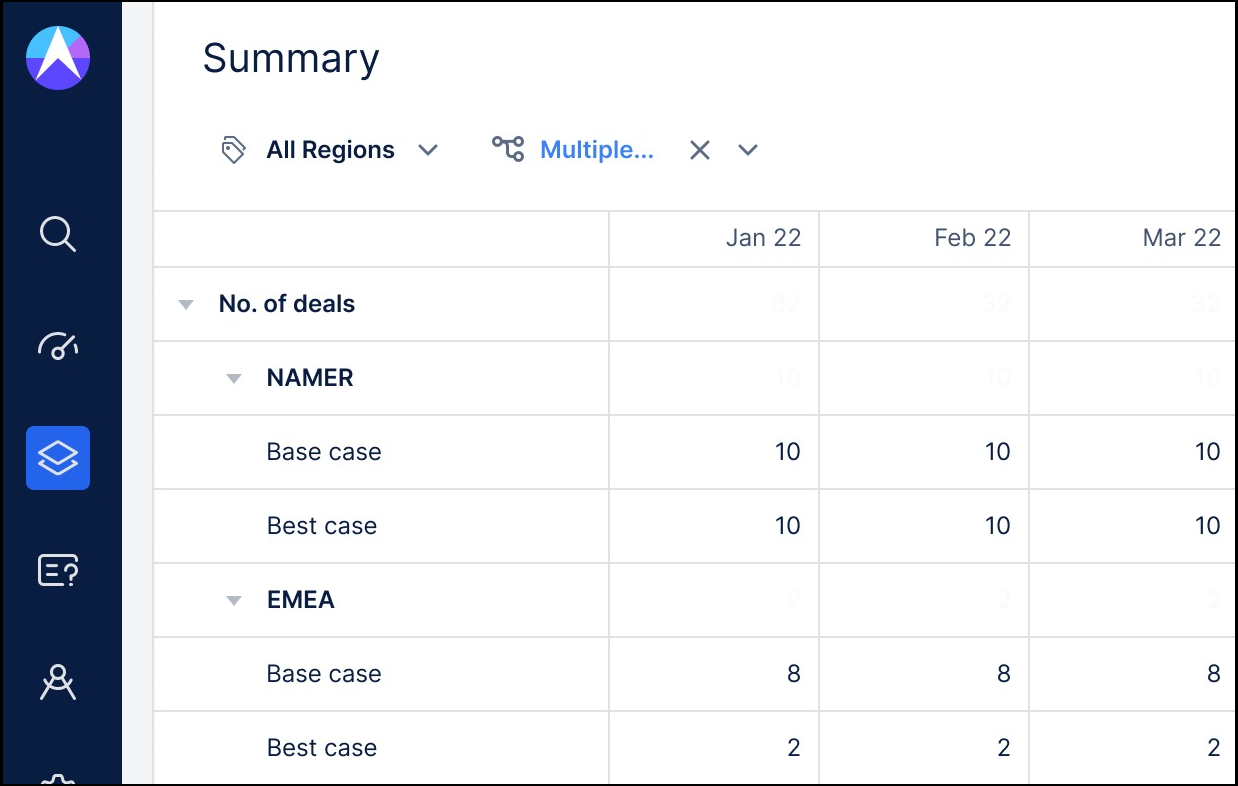
In this example, by deselecting the “worst case” value, our view automatically shows us just the results for “base case” and “best case”.
These are simplified examples, but it’s easy to imagine how Multi-Select, combined with Pivot, would help you easily filter the very large and complex data sets finance teams typically work with on a day-to-day basis. And, the best thing is, all the underlying data and calculations you have built into your view remain intact.
Are you ready to start asking deeper questions of your financial data? Contact us today to learn more about Drivetrain and the many features it provides to make FP&A easier.


.svg)


.svg)