We use cookies to provide visitors with the best possible experience on our website. These include analytics and targeting cookies, which may also be used in our marketing efforts.
This website stores data such as cookies to enable essential site functionality, as well as marketing, personalization and analytics. By remaining on this website, you indicate your consent.
What is Churn Rate? Definition, Calculation, and SaaS Benchmarks
Churn rate offers SaaS companies unique insight into their health and growth. In this guide, we explore how to calculate churn rate, what affects churn rate, and why churn rate is so important.
Thank you! Your submission has been received!
Oops! Something went wrong while submitting the form.
Oops! Something went wrong while submitting the form.
https://www.drivetrain.ai/post/
Link Copied
Lorem ipsum dolor sit amet, consectetur adipiscing elit. Suspendisse varius enim in eros elementum tristique. Duis cursus, mi quis viverra ornare, eros dolor interdum nulla, ut commodo diam libero vitae erat. Aenean faucibus nibh et justo cursus id rutrum lorem imperdiet. Nunc ut sem vitae risus tristique posuere.
What’s a Rich Text element?
The rich text element allows you to create and format headings, paragraphs, blockquotes, images, and video all in one place instead of having to add and format them individually. Just double-click and easily create content.
Static and dynamic content editing
A rich text element can be used with static or dynamic content. For static content, just drop it into any page and begin editing. For dynamic content, add a rich text field to any collection and then connect a rich text element to that field in the settings panel. Voila!
How to customize formatting for each rich text
Headings, paragraphs, blockquotes, figures, images, and figure captions can all be styled after a class is added
fnjksnweffw
nckwkecjwncj
cnwk wknw
w ww l
-
1. to the rich text element using the "When inside of" nested selector system.
nfvkjvnv
e kjvnvkjv
ckc kvjvk
kvjneknek
Analyzing the changes in a SaaS company’s customer numbers and revenue over time offers insight into its health and growth. One of the most common metrics used to measure these changes is churn rate.
So, what is churn rate? The churn rate or customer churn rate is the percentage of customers that do not renew their subscriptions over a specified period such as a month or year. Companies can also calculate revenue churn rate, which is the percentage of revenue a company loses over a specified period.
Here’s everything you need to know about calculating customer and revenue churn, reducing churn rates, and how your company compares to established SaaS benchmarks.
So why is churn rate so important for SaaS companies? Churn rates are important for SaaS companies since they are a great way to measure how secure your revenue streams are in the long run.
Churn can influence your growth rate. The higher your churn, the more money you’ll have to spend to maintain your company’s growth. This is because for every single customer that churns, you need to attract two new customers to maintain growth (one new customer to replace the one you lost and another new customer to grow). As customer acquisition costs much more than customer retention, maintaining growth through high churn is costly.
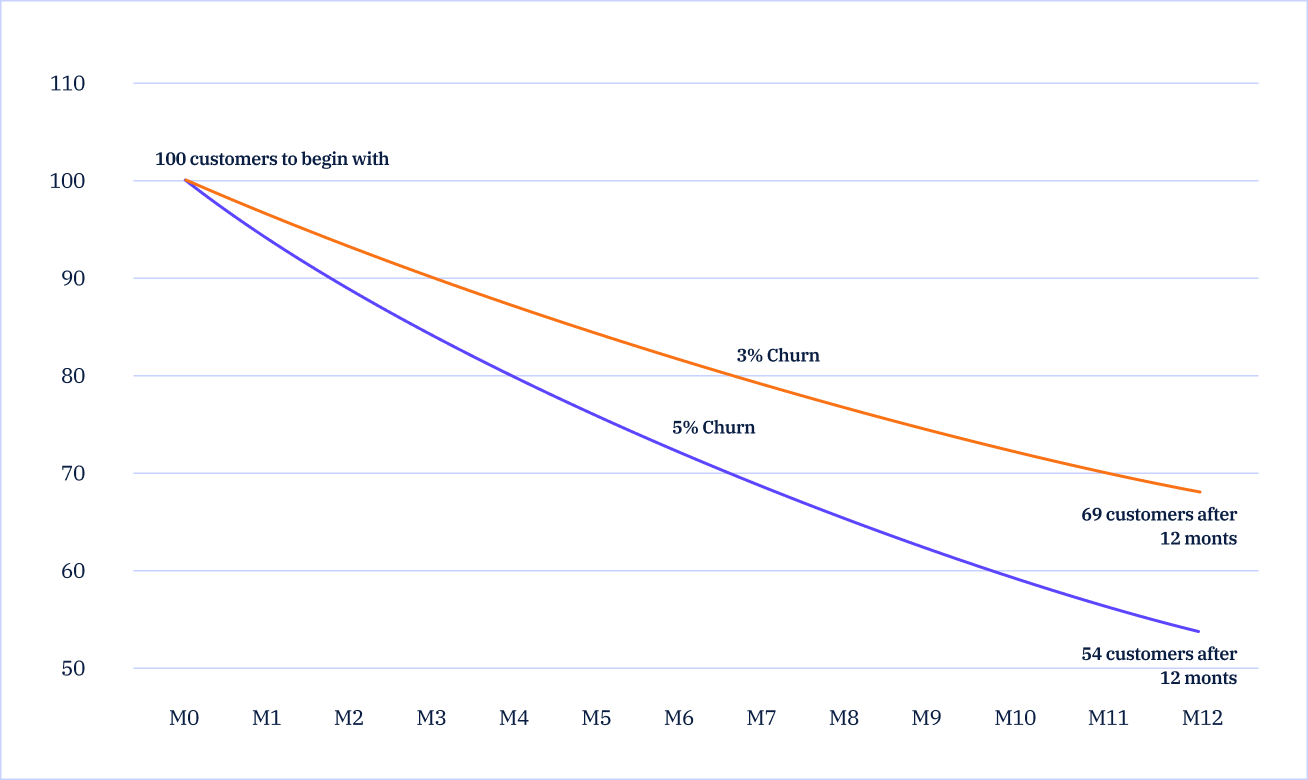
Churn also has a negative compounding effect, meaning that seemingly incremental changes in churn can have an outsized impact on your revenue over time. As illustrated in the figure below, if your company’s monthly churn is 3%, the negative impact on your revenue is initially relatively small but grows larger over time resulting, in our example, a loss of 31% of your customers and the revenue they bring into your business. And if your churn grows by 2%, that loss becomes 54%. Replacing the revenue lost through churn with new bookings becomes increasingly difficult over time, which is why churn remains an important metric to track.
The negative compounding effects of monthly churn on a SaaS business.
Here are a few other useful insights churn can provide for your business:
Churn rate is used to calculate your average customer lifetime in months – You can calculate your average customer lifetime using the formula, 1/monthly churn rate.
The result is one of the values you’ll plug into your company’s lifetime value (LTV) formula, which determines the average revenue produced by each customer.
Churn rate is a key part of your net revenue retention (NRR) – NRR and Rule of 40 are directly correlated to a company’s valuation. Reducing churn will increase your NRR.
Churn can provide insight on the pricing and packaging of your products – Looking at churn rates and the reasons it occurs in different dimensions of your business (e.g. product line, segment, or region) offers insight into whether your pricing and the packaging of your plans is affecting customer retention.
There are a few different ways that the SaaS industry calculates churn rates. We recommend calculating it by considering only those customers whose contracts are coming up for renewal. This is key because if your company is not based on monthly renewals and your customers instead sign annual or multi-year contracts, calculating a churn rate that includes all your customers (or their ARR) would result in a lower churn rate that is not representative of your business.
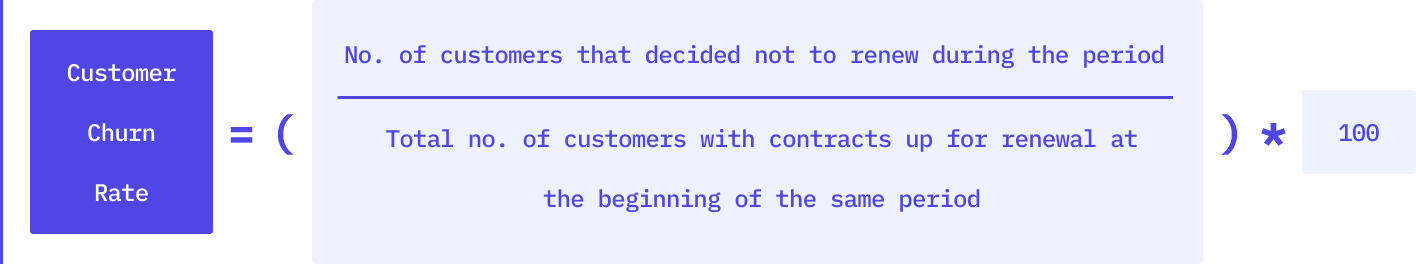
You can calculate customer churn rate using this formula:
Customer churn rate can be calculated for any time period based, using as your basis only those customers whose contracts are up for renewal.
Although “churn” in a business typically refers to customer churn, you can also calculate revenue churn rate. Customer churn rate and revenue churn rate are essentially two sides of the same coin – they tell you how much business you’re losing, either in terms of customers or revenue due to churn. The revenue churn rate formula, which also factors in the offsetting effects of upgrades, is slightly more complicated:
Formula for calculating revenue churn rate.
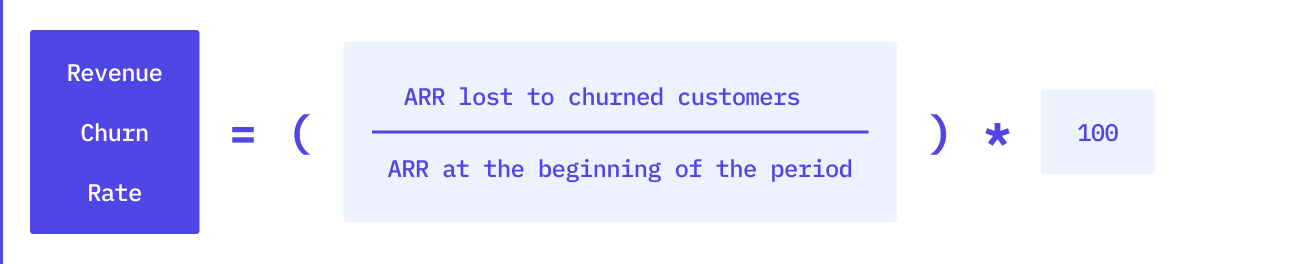
There is, however, a simplified way to calculate revenue churn rate if you want to look only at revenue churn without consideration of how new revenue from upgrades might be offsetting the revenue loss from churn:
Simplified formula for calculating revenue churn rate, without consideration of new revenue from upgrades.
Steps to calculate your churn rate:
Choose the time period over which you want to determine your churn rate. You can use any time period that’s relevant to your business, but churn rate is typically calculated on a monthly or annual basis.
Determine the values for the variables in the formula you’re using (either the number of customers or ARR) that you had at the beginning and end of the chosen period. Note that to get the value for Upgrades in the revenue churn rate formula, you’ll also need to calculate expansion ARR throughout the chosen period.
Divide the amount of churn (either the number of customers or the ARR) over that time period by the value for the same variable (number of customers or ARR) at the start of the period.
Multiply the result by 100 to get the churn rate.
Calculating churn rates -- An example
Here is a simple example of calculating the annual customer churn and revenue churn rates for a SaaS company. Here are the values we have to work with:
Our example company has two SaaS product tiers:
Basic -- 10,000 customers paying $200 a month
Pro -- 2,000 customers paying $800 a month
The ARR for each of these product lines is as follows:
Basic -- (10,000 customers * $200) $2,000,000
Pro -- (2,000 customers * $800) $1,600,000
Total MRR -- $3.6M from 12,000 customers
Let’s assume that in one month:
400 customers on the basic tier churn
50 customers on the pro tier churn
None of the customers on the basic tier upgraded their subscriptions
Here’s how we can use this information to calculate the company’s monthly customer and revenue churn rates with the formulas provided above:
Example calculation of a SaaS company’s monthly customer and revenue churn rates.
What affects churn rates?
Customer and revenue churn is caused by three main factors:
Change in ownership – For example, if a business is acquired by a new parent company using different software or business models, it can cause an increase in churn.
Change of sponsor – When the person who bought your product (the product champion) leaves the company, it increases the risk of the subscription getting cancelled.
Customer dissatisfaction – Many circumstances can cause customer dissatisfaction, including poor customer service or customer experience, slow time to value, a sub-par onboarding experience, or missing features and security requirements.
Another type of churn, known as delinquent or involuntary churn, happens regardless of your customer’s opinion of your business or product.
Common causes of delinquent churn are when:
The credit card attached the account has expired.
There are insufficient funds in the customer’s account.
The bank prevents payment in an attempt to protect your customer from potential fraud.
Some sort of technical glitch has prevented the payment from going through.
According to Recurly Churn Rate Benchmarks, SaaS companies lose more than 1% of their customers to delinquent churn every year. Companies can reduce this number using decline management techniques like account updater services or dynamic retry logic.
How do you reduce churn rate?
How to reduce churn rate is a question routinely product development and customer success teams by company management. Unfortunately, there isn’t a straightforward answer.
One way to reduce your churn rate is to regularly highlight the value your product has provided your customers over time. By illustrating how your product is helping your customers meet their objectives, you increase their confidence in the investment they have made with your company and reduce their likelihood of churning.
Additionally, the following steps can help the relevant teams analyze and reduce churn rates:
Survey prospects that didn’t convert after trials Learning why they chose not to sign up will reveal shortcomings in your products and processes that you might be able to improve on.
Offer incentives to existing customers – Running promotions or offering discounts to existing customers near the end of their subscription period encourages them to renew, thereby reducing customer and revenue churn.
Increase your average subscription length – The longer a customer stays subscribed, the lower the customer and revenue churn rates. An annual subscription billing model will, therefore, result in lower churn rates compared to a month-to-month alternative.
Experiment with longer term contracts – This can help reduce the opportunity to churn. Generally speaking, enterprises are much more willing to sign longer term contracts than small or medium sized business (SMBs).
Look deeper into your churn – depending on how many markets or verticals you serve, you may find that some of them are more likely to churn than others or other types of trends. By evaluating different aspects of your churn, you can uncover insights that you can act on to reduce it.
Ideally, negative churn should be your goal. Negative churn happens when expansion ARR exceeds churn ARR. Some of the ways to achieve negative churn include:
Upselling by encouraging existing customers to subscribe to additional seats, or premium plans, or add-ons, or encouraging higher usage.
Cross-selling by offering customers additional products when they subscribe to one of your services.
The lower your churn rate, the better. It’s a statement that really goes without saying but also leaves a lot of room for speculation. No matter how big or successful your SaaS company is, some amount of churn is inevitable. But how much is too much churn?
Looking at churn through the lens of retention
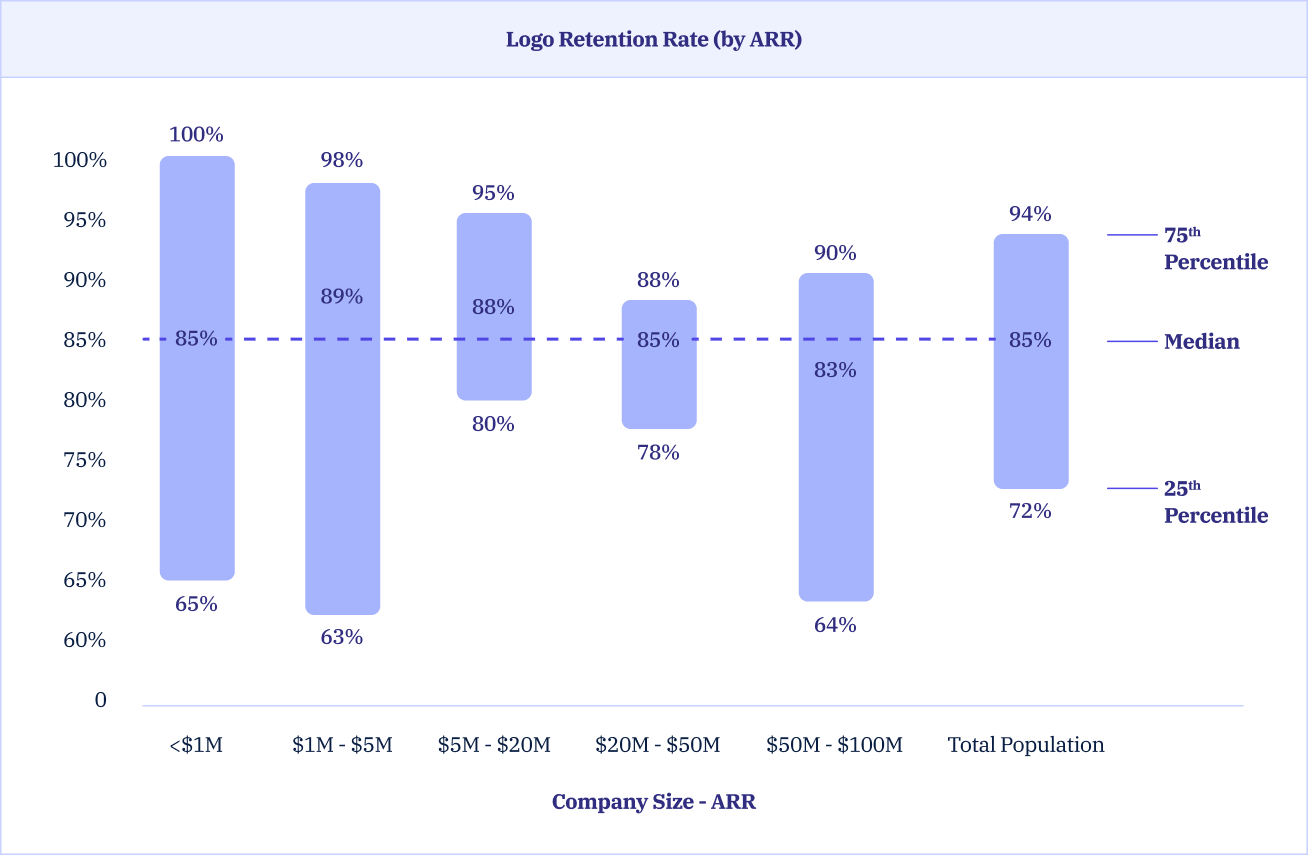
Very few companies report their churn rates. However, there may be some insight to be gained by looking at the RevOps Square 2022 SaaS Benchmarks, where you can find some interesting information about logo retention rates (among other things). Since churn is the opposite of retention, we can use these results to get some insight as to what churn looks like for companies of different sizes and for different annual contract values (ACVs).
Using the logo retention rates based on average contract value from the RevOps Squared repot to infer churn, which is the opposite of retention (Source).
The problem with churn rate
Considering the variations in churn rates shown above, it’s obvious that there is no single acceptable churn rate range across the board for SaaS companies. This is because churn is affected by a few factors:
Contract length – Your churn rate can vary depending on the lengths of the contracts you sign. Longer contracts have fewer opportunities for cancellation compared to shorter contracts.
Niche-industry price benchmarks – A company offering a niche service or product at a competitive price is likely to experience lower churn rates. Because switching to a reliable competitor may be challenging and more expensive, customers are less likely to leave.
Insufficient reporting data – Only a few SaaS companies publish their churn rates, and when they do it’s typically only a general range. As a result, it can be difficult to compile enough data to accurately determine average and ideal churn rates.
Given these factors, how can you figure out whether your churn rate is normal or a cause for concern?
What is your ideal churn rate?
The ideal churn rate for your business depends on a variety of factors, and there’s no one-size-fits-all percentage across the board. It’s always good to look at how your direct competitors are doing, but that’s often not possible.
According to SaaS Performance Benchmarks, the median annual ARR churn rate for a company with up to $5 million ARR is 12%. The median annual customer churn rate is 14%. If possible, Keeping these benchmarks in mind during your SaaS company’s continuous planning will let you gauge the performance of your customer retention efforts.
Drivetrain simplifies churn rate tracking and revenue analysis by offering you access to the following features and processes.
On-the-go revenue tracking and forecasts – Instant access to accurate revenue evaluations and forecasts allows you to easily calculate revenue and customer churn over any time period.
Automated real-time reporting – View changes in churn and ARR on dedicated dashboards instead of conducting arduous SaaS planning on Excel makes tracking customer and revenue churn rate faster and more accurate.
Take advantage of intelligent SaaS scenario planning -- Model different churn scenarios to assess how different reductions in churn will affect your revenue while also focusing on SaaS metrics-based planning to keep these rates down. Alternatively, you can also monitor the effect churn reduction has on your year-end ARR and include these considerations in your planning.
Customer and revenue churn rates are useful metrics used to assess your SaaS company’s growth and health. Although negative churn rates are ideal, in reality, you will always experience some degree of churn.
Want to simplify churn rate tracking and lower your revenue and customer churn? Let us show you how, in Drivetrain.
Customer churn rate is the percentage of customers failing to renew their subscriptions over a period. The revenue churn rate definition varies slightly and is the percentage of revenue a company loses due to churn over a specific period.
How do you reduce churn rate?
The number one way to reduce your churn rate is to highlight the impact or value your product offers your customers. By illustrating how your product is helping your customers meet their objectives, you increase their confidence in the investment they have made with your company and reduce their likelihood of churning.
What is the average churn rate for a SaaS company?
There is no single average acceptable churn rate for SaaS companies across the board. However, according to SaaS Performance Benchmarks, companies with an ARR of $1-5 million reported a median annual ARR churn rate of 12% and a median annual customer churn rate of 14%.
What is a good churn rate?
The lower your company’s churn rate, the better. That said, it’s nearly impossible to choose a single churn rate range that’s “good” for any SaaS company at any stage in its development. Determining a good churn rate requires benchmarking your company against your direct competitors.
What does 5% churn mean?
5% churn means a company is losing 5% of either its revenue or customers over a specific period like a month or year. For example, if your company experiences 5% monthly customer churn and started the year with 100 customers, assuming no additional growth (that is no new customers), you will only be left with 54 of those original customers by the end of the year. So, a 5% monthly churn would see you lose 46% of your customer base in one year.
The only financial model template you'll ever need—just plug in your actuals to see projections
Thank you! Your submission has been received!
Oops! Something went wrong while submitting the form.


.png)


.svg)