.svg)
.svg)
.png)

- Top line means a company’s total revenue before expenses.
- Bottom line means a company’s net profit after expenses.
- The top line shows growth, while the bottom line shows profitability.
- The top line can rise while the bottom line falls if costs increase faster than revenue.
- Strong businesses aim for sustainable growth in both top line and bottom line over time.
In finance, you’ll often hear the terms top line and bottom line. They represent two different measures of a company’s performance. Understanding the difference helps investors, business owners, and internal teams evaluate how well a company is truly performing.
For finance leaders, these metrics shape day-to-day decision-making. The top line often attracts the most attention because it signals growth, market demand, and momentum. But the bottom line reveals whether that growth is efficient, sustainable, and ultimately valuable.
In this article, you’ll learn what top line and bottom line mean, the key differences between them, how they affect each other, and when businesses should prioritize one over the other depending on their stage and strategy.
Top line vs. bottom line: definitions, key differences and business impact
Understanding the difference between top-line and bottom-line performance is essential when evaluating a company’s financial health. While both metrics come from the income statement, they measure very different aspects of business success.
What is top line?
The top line refers to a company’s total revenue or sales before any expenses are deducted. As the name suggests, it appears at the top of an income statement.
Top-line growth is often used as a key indicator of business expansion and market demand. When a company reports rising revenue, it can signal stronger customer acquisition, higher pricing power, increased sales volume, or successful entry into new markets. For startups and growth-focused companies, improving the top line is often a major priority because it demonstrates traction and future potential.
How can a business grow its top line?
Top-line growth comes from increasing demand and improving how efficiently that demand converts into revenue.
- Acquire more customers: Expand distribution, enter new markets, or increase reach.
- Increase conversion rates: Optimizing pricing, positioning, and sales execution.
- Expand customer value: Increase upsells, cross-sells, or usage.
What is the bottom line?
The bottom line refers to a company’s net profit, the amount left after subtracting all costs, taxes, interest, and expenses. It appears at the bottom of the income statement.
Bottom-line growth is viewed as a sign of profitability, efficiency, and strong financial management. When net income increases, it may indicate that a company is controlling costs effectively, improving margins, or generating higher-quality earnings from its revenue base.
The expenses for a company that impact its bottom line include a myriad of costs related to:
- Delivering products or services, including production, inventory, logistics, facilities, customer service, and support teams.
- Research and development (R&D), such as payroll for engineers, designers, product teams, and the tools or systems used to improve offerings and drive innovation.
- Sales and marketing (S&M), which includes activities related to content marketing, social media, advertising, promotions, and sales teams.
- General and administrative (G&A) expenses, including overhead costs, finance, HR, legal, administrative staff, and other expenses associated with running the business.
How can a business grow its bottom line?
Bottom line growth comes from improving efficiency and tightening cost discipline as revenue scales.
- Improve gross margins: Reduce cost of goods sold (COGS), optimize suppliers, refine pricing.
- Control operating expenses: Eliminate inefficiencies and unnecessary spend.
- Increase productivity: Boost productivity through smarter people management, AI, and automation.
- Focus on high-margin segments: Prioritize more profitable customers, products, or markets.
What are the key top-line metrics to consider?
Top-line metrics indicate how effectively a business is generating sales and expanding its market presence. To assess performance, businesses typically monitor several core indicators:
- Revenue is the total income generated from sales of products or services over a given period. It is often the primary indicator of business scale.
- Recurring revenue, such as monthly recurring revenue (MRR) or annual recurring revenue (ARR), is especially relevant for SaaS and subscription businesses because it reflects predictable future income.
- Revenue growth rate measures how quickly revenue is increasing over time, whether month over month, quarter over quarter, or year over year. This helps assess momentum and demand.
- Average order value (AOV) or average selling price (ASP) measures the average revenue earned per transaction, order, or contract. E-commerce and retail businesses typically use AOV, while B2B and service businesses often use ASP. Increasing either can support growth without requiring additional customers.
- Customer count and new customers measure the number of existing customers and how many new customers are acquired in a period. These figures help track market traction.
- Customer retention measures how effectively a business keeps customers over time. High retention often indicates strong customer satisfaction, loyalty, and recurring revenue potential.
- Customer lifetime value (LTV) estimates the total revenue or profit expected from a customer over the duration of the relationship.
- Market share indicates the percentage of total industry sales captured by the company. Growing market share signals competitive strength.
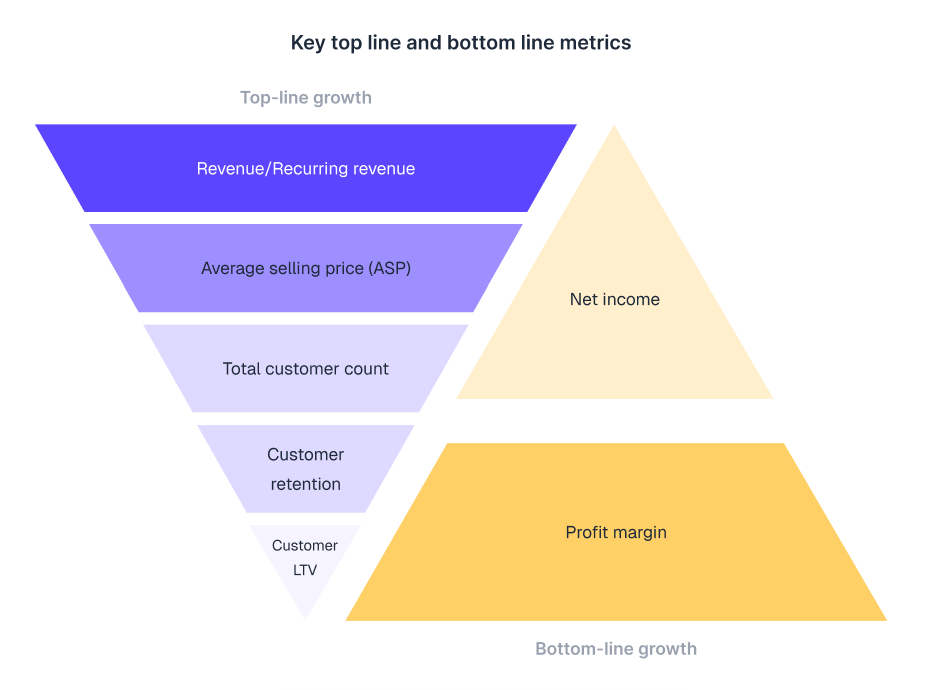
What are the key bottom-line metrics to consider?
Bottom line metrics show whether growth is financially sustainable and how well the business converts revenue into profit. To evaluate profitability more closely, companies track several key indicators:
- Gross profit is revenue minus the direct costs of producing goods or delivering services. It reveals the profitability of core operations.
- Gross margin expresses gross profit as a percentage of revenue. Higher margins typically indicate stronger pricing power or operational efficiency.
- EBITDA stands for earnings before interest, taxes, depreciation, and amortization. It is commonly used to evaluate core operating performance.
- Net profit or net income is the amount remaining after all expenses have been deducted. It is often considered the true bottom line.
- Net margin percentage measures net profit as a share of revenue, helping compare profitability across time periods or competitors.
- Operating cash flow reflects the actual cash generated from day-to-day business operations.
- Free cash flow is the cash remaining after capital expenditures. It is a key measure of financial flexibility and value creation.
- Burn rate, especially relevant for startups, measures how quickly the company is spending cash reserves.
How top-line growth affects bottom-line growth
Understanding how your top line translates to the bottom line is essential for financial management and long-term planning in your business.
Revenue growth does not automatically increase profit
Higher revenue does not automatically lead to higher net profit. What matters is whether the additional sales generated exceed the additional costs required to produce them.
When revenue increases faster than costs, net profit usually rises, and net profit margin improves. When costs grow at roughly the same pace as revenue, net profit may increase in dollar terms while net profit margin remains unchanged. If costs rise faster than revenue, both net profit and net profit margin can weaken despite stronger sales.
For management teams and long-term planning, the quality of growth is often more important than the size of growth. Rising revenue is valuable only when it converts efficiently into sustainable earnings.
Operating leverage and cost structure
Fixed or semi-fixed costs do not increase in proportion to revenue. They’re required to run the business regardless of scale. When these costs make up a meaningful share of total expenses, businesses can generate additional revenue with relatively little added expense (i.e., low incremental costs).
This creates operating leverage: when most costs are fixed or semi-fixed, you don’t have to spend much more to grow, so a larger share of each new dollar becomes profit.
For example, let’s say a business spends $100K on marketing to generate $1M in revenue. Then, after increasing its marketing spend to $120K, revenue grows to $2M. Because the incremental cost of acquiring that revenue is low, a large share of that additional revenue can flow to profit, assuming other costs do not increase significantly.
Reinvestment and short-term profit impact
Top-line growth can reduce profit when revenue is reinvested into the business. As revenue increases, companies often spend more on hiring, expansion, or product development to sustain growth. These costs appear immediately, while returns take time to materialize. During this period, profit can decline even though revenue is increasing.
Say a company grows from $1M to $2M in revenue and decides to hire new team members so they can enter new markets. Profit will likely decrease in the short term because these investments are made up front, with expected returns in the future.
Declining profit isn’t always a red flag, and reinvestment is a common reason why.
Revenue growth as a signal of future profit
Strong revenue growth shows demand and the ability to scale. It indicates that the business can generate increasing sales over time, even if current profits are lower due to reinvestment or early-stage costs.
Revenue growth is often used as a proxy for future earnings potential. Consistent growth suggests that once costs stabilize or scale efficiently, profit can increase significantly.
For example, a fast-growing software company may spend heavily today on hiring sales teams, product development, and international expansion, which keeps near-term profits modest. However, if revenue is growing 40% annually through new customer wins and renewals, investors may value it more highly than a mature company growing at 5% with similar profit, because it has greater potential earnings potential.
Real-world example of how top-line and bottom-line growth are related
The relationship between revenue growth and profit growth can be seen clearly in large-scale businesses that successfully convert expanding sales into stronger earnings over time.
Let's understand the relationship between top line and bottom line with the example of Netflix.
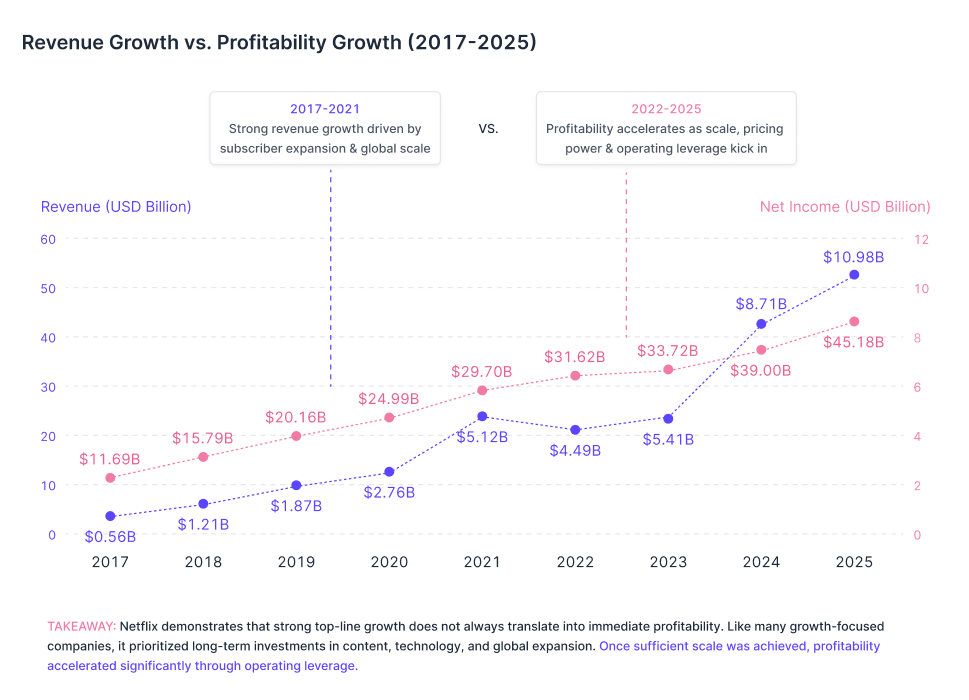
Netflix scaled revenue from $11 billion in 2017 to $45 billion in 2025, representing nearly 4x growth.
This growth was driven by:
- Subscriber expansion helped revenue growth, with the subscriber base increasing from 115 million in 2017 to 300+ million in 2025.
- Global expansion played a major role, with strong user growth across EMEA (~34% of users) and APAC (~17%).
- Pricing power also supported top-line growth, as subscription prices steadily increased over time. For example, the US standard plan rose from ~$7.99 in 2011 to $15.49+ in recent years.
Despite strong revenue growth, Netflix profitability remained constrained because the company continued investing heavily in long-term growth.
- Content production spending remained high at approximately $17–18 billion annually.
- Technology and infrastructure investments were significant, totaling around $1 billion per year.
- Marketing and customer acquisition costs also increased as the company expanded globally.
Netflix’s reinvestment was necessary to support growth, but it did delay bottom line expansion.
However, as Netflix achieved a larger scale, profitability meaningfully improved:
- Revenue surpassed $45 billion in 2025.
- Net income reached approximately $11 billion in 2025.
- Global ARPU improved to around $16.64 per month.
The Netflix example demonstrates that strong top-line growth does not always translate into immediate profitability. Like many growth-focused companies, it prioritized subscriber acquisition, global expansion, and long-term investments over short-term earnings. However, once sufficient scale was achieved, bottom-line performance improved significantly through operating leverage, showing how revenue growth can eventually convert into stronger profitability over time.
At what point does a divergence between top-line and bottom-line growth become a red flag?
Growing revenue and improving profit are not opposing goals, but they rely on different levers. In practice, they also do not always move together, and that’s not necessarily a problem. Some level of divergence is expected, especially during periods of aggressive growth or deliberate cost optimization.
A gap becomes a red flag when top-line and bottom-line growth move in opposite directions year over year, or when they do not grow proportionately. For example, if revenue is growing but margins are simultaneously compressing, it usually points to a spending problem in the company, where costs are scaling faster than revenue. Over time, this indicates weak cost control or inefficient growth, where the business is adding revenue but not translating it into profitability. ~ Mavin Kaur, Senior Manager, Strategic Finance at Drivetrain
The goal should be to achieve a balance between the top line and bottom line over time. Growth should not erode future profitability, and profitability should not limit future growth.
When to focus on top line vs. bottom line
The right focus depends on the stage of the business, its goals, and its financial position. Internally, this comes down to resource allocation. Where capital and effort are directed determines whether the business prioritizes growth, efficiency, or stability.
Early stage: top-line growth
This stage often includes startups at the pre-seed, seed, or Series A funding stage, along with those with newly-launched products and businesses entering new markets.
The goal is to prove demand, capture market share, and build distribution. Revenue and revenue growth is the clearest signal that the product works and that it can scale. Profit is not the priority because capital is deliberately reinvested into marketing, hiring, and product development to accelerate growth. Margins are often compressed in the short term. That is intentional.
Long before becoming public and mainstream, Uber accepted years of heavy losses because it prioritized global expansion, liquidity of driver supply, and market leadership over near-term corporate profitability, while expecting unit economics to improve later.
Expansion phase: balancing growth and efficiency
Businesses in this category often have proven demand, scaling operations, and growing market presence.
Revenue continues to grow, but there is more attention on how efficiently that growth is achieved. Marketing spend, team structure, and operations are optimized so that revenue growth starts translating into stronger margins. Operating leverage becomes more visible as fixed costs are spread across a larger revenue base.
Salesforce expanded rapidly for years, then increasingly focused on margin improvement and productivity as investors demanded more disciplined growth.
Mature stage: bottom line growth
This stage generally applies to established market leaders, stable mid-sized firms, and businesses with predictable demand.
Demand and scale are already established, so the priority becomes profitability, cash flow, and operational discipline. The business focuses on improving margins, reducing unnecessary costs, and increasing net profit consistently.
Apple is a strong example of a mature business prioritizing premium margins, cash generation, and shareholder returns through buybacks and dividends.
Two factors that can override stage-based priorities
While businesses often follow predictable priorities at different stages of growth, those priorities are not fixed. External pressures can force companies to abandon stage-based playbooks and respond to immediate realities instead:
1. Cash flow constraints
When capital is limited, the focus shifts to preserving the runway and maintaining stability. This typically means cutting discretionary spend, slowing hiring, and prioritizing profitability over expansion, regardless of where the business is in its lifecycle.
This shift was visible across the startup ecosystem in 2022–2023, as rising interest rates, lower tech valuations, and a slowdown in venture funding made capital harder to access. Companies were advised to focus on runway, reduce burn, and move toward profitability as funding slowed. Even high-growth companies cut costs, slowed hiring, and extended their runways regardless of stage.
2. Market conditions
In strong markets, firms may invest aggressively in hiring, marketing, and expansion. But in uncertain markets, priorities shift toward stability and efficiency.
A clear example is the COVID-19 pandemic in 2020, when travel demand collapsed globally. Airbnb announced workforce reductions and restructuring, stating it needed fundamental changes to survive the crisis. This shows how sudden market shocks can override normal growth-stage priorities and force survival-focused decisions.
Should a CFO protect the bottom line or the top line during a downturn?
In downturns, companies often make trade-offs that appear rational in isolation but create unintended second-order effects.
In a conversation with Mavin Kaur, Senior Manager, Strategic Finance at Drivetrain, she shared her observations about how one company navigated a downturn during the peak of COVID.
It was a Series A SaaS company that was facing slowing demand and growing uncertainty, yet it continued to pursue aggressive top-line growth without adjusting its operating model to fit its new reality:
- The company hired more sales reps to push growth while cutting backend and support functions to control costs, which led to poor customer experience and higher churn, widening the revenue gap even further.
- After a year, the company reviewed its sales performance, and underperformers (about 20% of the sales team) were let go. By then, the cost of over-hiring had already been incurred, even as churn continued to impact revenue.
- Instead of tightening operations, the company relied heavily on fundraising to extend the runway, without fixing underlying inefficiencies.
- They used investor capital to acquire other companies so they could add their ARR to the company’s reported growth, a tactic that improved YoY numbers but relied solely on inorganic expansion.
- They aggressively cut costs across the acquired companies, which compromised their financial performance over time, with ARR declining within just 2–3 years in some cases.
The pattern was consistent: short-term top-line optics were prioritized over long-term sustainability.
Growth and efficiency cannot be managed in isolation. Decisions that optimize one at the expense of the other, without accounting for how they interact, often create deeper structural issues over time.
How investors and lenders read topline vs. bottomline
Investors don't evaluate revenue and profit in isolation. What matters is how efficiently growth translates into actual earnings.
As this business scales, does profitability improve or deteriorate?
Healthy companies tend to show operating leverage. Revenue grows first, and over time, margins expand as fixed costs are spread across a larger base. A business that doubles revenue and improves margins signals control and scalability. One that grows revenue but sees margins compress indicates weak unit economics or rising inefficiencies.
Equity investors, particularly those focused on growth-stage companies, look at a growth-stage business through the lens of revenue and gross profit. These indicate real demand and pricing power. Their assumption is that many costs, especially sales and overhead, can be optimized later, but weak revenue quality is difficult to fix.
Lenders look at the same business through a different lens. Their focus is repayment certainty, which makes cash flow, EBITDA, and coverage ratios more important than growth. For them, stability matters more than potential
Frequently asked questions
Yes. If costs rise faster than revenue, profits fall. Common reasons are heavy marketing spend, discounting, or rising operating costs.
Yes. A company may maintain strong profits through cost control while experiencing slow or declining revenue growth. Over time, weak revenue growth can limit future expansion.
No. EBITDA (earnings before interest, taxes, depreciation, and amortization) measures profit from core operations before financing costs, taxes, and non-cash accounting charges such as depreciation and amortization. The bottom line, typically net profit, reflects earnings after all expenses have been deducted.
The triple bottom line is a business framework that measures success using the 3 P’s: people, planet, and profit. It expands the traditional focus on financial results by also considering social impact and environmental sustainability alongside profitability.
Gross profit shows product-level efficiency after direct costs. The bottom line reflects total profit after all expenses.

.jpg)
.png)

.webp)


