

Balance sheet forecasting can offer important insights into the future financial position of your SaaS company. Our comprehensive guide will give you everything you need to know about balance sheet forecasting, including what it is, why it's important, and how to do it.
A balance sheet is a strategic tool that is pivotal for the growth and stability of your SaaS business. While it does involve a lot of number crunching, balance sheet forecasting will provide you with insights that will be crucial for your decision-making.
A typical balance sheet will cover your assets, liabilities, and equity. However, for SaaS companies, it can be hard to know how to translate these categories into specific line items on the balance sheet.
This guide will present the unique aspects of a SaaS company's balance sheet and give you a step-by-step process for balance sheet forecasting that you can use to gain insight into your business's future financial position.
What is balance sheet forecasting?
A balance sheet forecast (also called balance sheet projection) is a projection of what your company's assets, liabilities, and equity will be in the future, based on your understanding of current growth, historical trends, market and industry economics, and the strategic financial initiatives you currently have in play.
The balance sheet is a key component of the three-statement model, which also includes a cash flow forecast and an income statement. Together, these three financial statements comprehensively depict a SaaS company's financial performance, stability, and future financial potential.
Balance sheets
Balance sheets reflect a company's financial position at a specific point in time, showing assets, liabilities, and equity. Balance sheets are important for understanding the capital structure and overall financial health.
Income statements
Income statements detail a company’s revenues and expenses over a predetermined period of time providing insight into the company's profitability (or lack thereof). These statements are vital for understanding the sustainability and growth potential of your business.
Cash flow forecasts
Cash flow forecasts show the inflow and outflow of cash, which is crucial for managing recurring revenue streams and the substantial upfront development costs SaaS companies typically incur.
A cash flow statement is linked to the income statement and balance sheet. It shows how profits translate into cash flow, which is essential for sustaining operations and funding growth.
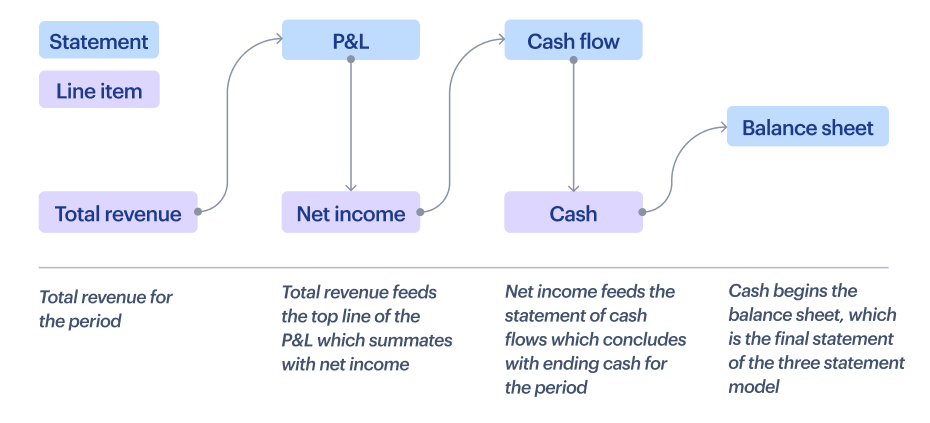
Note that while you must have your balance sheet prepared in order to do a cash flow forecast, creating a balance sheet doesn’t depend on first having a cash flow statement. The figure below, which shows how data flows through the different statements in the three-statement model illustrates this.
How balance sheet forecasting can help your business
Balance sheet forecasting, if done correctly, offers many benefits to a SaaS business.
Helps you track your cash balance
For SaaS businesses, balance sheet forecasting not only helps you track your cash balance but can also help you more effectively manage recurring revenue streams.
Provides a snapshot of the health of your business
The balance sheet forecast provides a quick and clear snapshot of a SaaS company's projected financial health in terms of its assets, including recurring subscriptions, liabilities, and equity.
These assets are essential for assessing the company's stability and growth potential. Thus, your balance sheet helps your investors/bankers determine how well (or poorly) you’ve utilized their funds.
Balance sheet forecasts also enable you to make more informed business decisions regarding new investments, expansions, and resource allocations.
Helps you quickly see what your loan balances are
Balance sheet forecasting enables SaaS businesses to review outstanding loan balances at a glance.
Doing so helps you assess the impact of debt on your overall financial health, better manage your long-term financial commitments, and better evaluate your ability to launch new initiatives, such as new product development or market expansion.
Boosts investor confidence
A balance sheet forecast can increase investor confidence by demonstrating a clear financial trajectory for your company and its overall stability.
Helps to mitigate risk due to economic uncertainty and other factors
Balance sheet forecasting helps identify potential financial risks, such as liquidity issues, early, giving you time to proactively develop strategies to mitigate them.
A balance sheet forecast also provides key insights into your company's future funding and debt balances. If you have loans, a forecast gives you an opportunity to explore strategic refinancing options during economic downturns.
It also allows you to assess your asset utilization to inform potential decisions on asset reallocation or downsizing, if necessary, to weather economic challenges.
Understanding key line items in a balance sheet
There are essentially two types of balance sheets: a current balance sheet and a forecasted balance sheet or balance sheet projection. The current is a snapshot of your business now, and the forecast will help guide you in decision-making.
The line items on a balance sheet are grouped into three main categories: assets, liabilities, and shareholder's equity.
Assets
Current assets
- Cash and equivalents represent the liquid capital available for day-to-day operations. With this cash, SaaS companies can scale their business and invest in building new features and products.
- Accounts receivable (AP) is the money customers owe for your company’s subscription services.
- Prepaid expenses are payments made in advance for services or goods to be received in the future. These might be pre-payments for long-term server hosting or software licenses, among other things. Though not immediately realized as cash, these expenses are essential for ensuring a smooth and uninterrupted service delivery to your customers.
Non-current assets
Also called long-term assets, are assets and property that cannot be easily converted to cash within a year.
The categories on a balance sheet typically under non-current assets include:
- Plant, property, and equipment (PP&E) are generally any physical assets the company owns.
- Intangible assets, for a SaaS business, include product patents, trademarks, brand name, and goodwill. Capitalized software development costs are increasingly being included in intangible assets for a SaaS business
Note that valuing intangible assets is a very complex task. It requires a lot of workpapers to show, for example, that the value of a software engineer’s idea from R&D is worth $2 million and should be valued as such. In order to demonstrate that they are not inflating the value of their intangible assets, companies commonly engage outside firms that specialize in valuations of this kind.
Liabilities
Liabilities help a SaaS company understand its short-term and long-term financial obligations and are an important factor to consider in financial planning and assessing the stability of the company.
Current liabilities
- Accounts payable are short-term obligations to vendors and suppliers. For instance, you might have accounts payable to your cloud infrastructure provider or design software licensing fees.
- Current debt/notes payable include any short-term loans you might have taken, say, for geographical expansion or rapid product development, and that need to be repaid within a year.
- Current portion of long-term debt is the portion of any long-term debt you have that’s due within the upcoming year.
Non-current liabilities
- Bonds payable are long-term bonds issued by the company to investors. A SaaS company typically issues bonds when they need to fund extensive research and development or enter new markets.
- Long-term debt represents loans due at some point beyond the next year. These are typically long-term loans for sustained product innovation and global expansion.
Shareholder's equity
- Share capital represents funds raised by issuing shares (or, in simple terms, equity in the company) to investors. These could be funds from angels, venture capitalists, or, at a later stage, from public market investors.
- Retained earnings is the accumulated net income reinvested in the business to fuel innovation, market expansion, or customer acquisition. The link between retained earnings and the income statement is crucial in a three-statement model, as it reflects the company’s ability to generate and retain profits over time.
How to build your forecasted balance sheet
Step 1. Gather the data
To get started, you’ll need either a previous balance sheet or actuals data from the most recent period.
Once you have your data, the remaining steps can be done in any order, really. We’ve presented them here in the typical order they appear on the balance sheet to make the process easier to follow.
Step 2: Forecast your assets
How to forecast cash
The cash forecast usually comes from your statement of cash flows.
This historical data then becomes the foundation for forecasting future cash positions. To forecast cash, you’ll identify trends and patterns in how cash moves through your business, which you can then use to make projections for future periods under various scenarios.
This activity will help your business anticipate future cash requirements, manage liquidity, and make informed financial decisions.
How to forecast accounts receivable
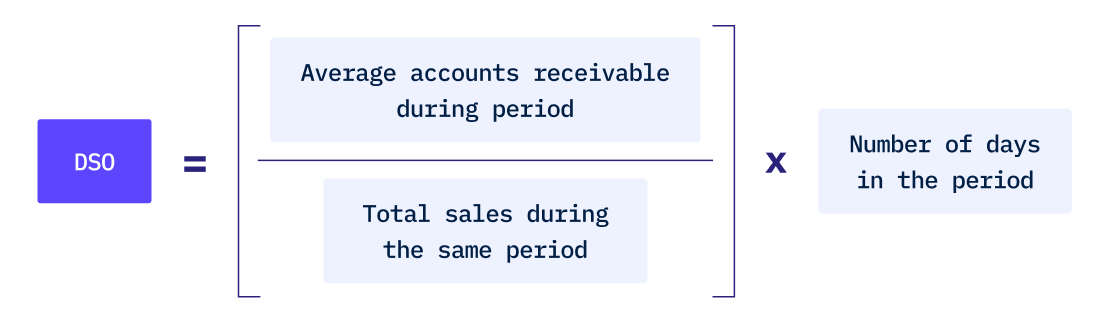
To forecast the accounts receivable, you’ll use an accounting metric called days sales outstanding (DSO), which for SaaS, measures the average number of days it takes your business to receive payment for the service your customers purchase but pay for through subscription billing.
The higher the DSO, the longer it takes for the company to collect the payments. However, DSO is usually not a problem for SaaS companies. This is because with the subscription model, customers know that you can revoke access if they don't pay on time. So, a typical DSO for most SaaS businesses will be around 30 days.
You can use the formula below to calculate DSO using the AR for the prior period or most recent balance sheet and your sales from the previous period’s income statement:
Now, let’s take a look at an example DSO calculation, which we need to do first in order to do a forecasted balance sheet:
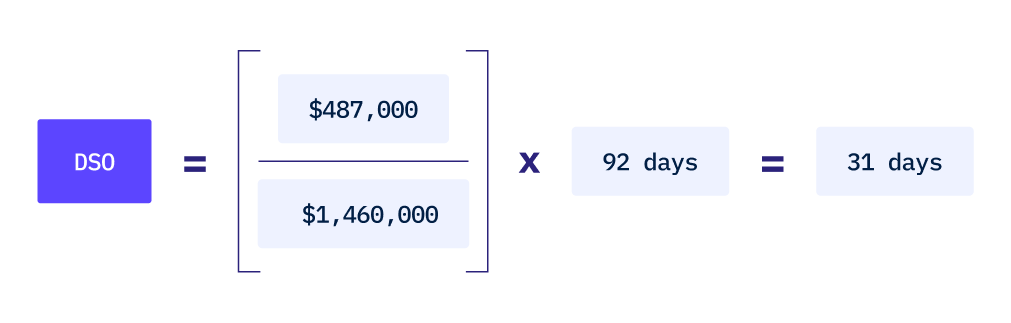
Now that we know our DSO for the last period, we can use the same value to forecast our AR.
We’ll also need to know our forecasted sales. This value will come from our forecasted income statement, which is a different forecast developed independently of our balance sheet forecast.
With forecasted sales and assuming the same DSO, we can use the equation above to forecast the AR for our balance sheet forecast:

Continuing with our previous example, we end up with:

How to forecast prepaid expenses
Forecasting prepaid expenses requires the following:
- Review your historical trends to analyze past prepaid expenses to identify patterns or seasonality.
- Factor in any known future expenses that will be paid in advance, such as annual software subscriptions or cloud costs
- Estimate how business growth and expansion plans might increase future prepaid expenses.
- Factor in any anticipated changes in contracts or service agreements that could affect your prepaid expenses.
How to forecast PP&E
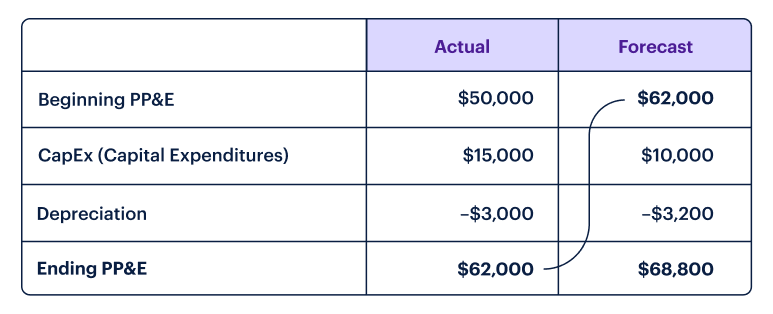
To calculate your PP&E, you can use a corkscrew model, which is also known as a roll-forward calculation. With this model, you roll the balance from each year to the next as the opening balance.
As mentioned, PP&E is typically low for most SaaS companies. However, for our example, let’s say that at the beginning of the previous period, we had $50,000 in PP&E assets on our balance sheet, we spent another $15,000 in capital expenditures (CapEx), and we had $3,000 in depreciation of our original PP&E balance.
With this information, we can calculate the PP&E at the end of the previous period and carry that over to our balance sheet forecast. Then we add in any new CapEx planned for the coming year and subtract the depreciation based on the beginning PP&E to get our forecasted PP&E balance, which is $68,800 in our example:
Step 3. Forecast your liabilities
Forecast your accounts payable
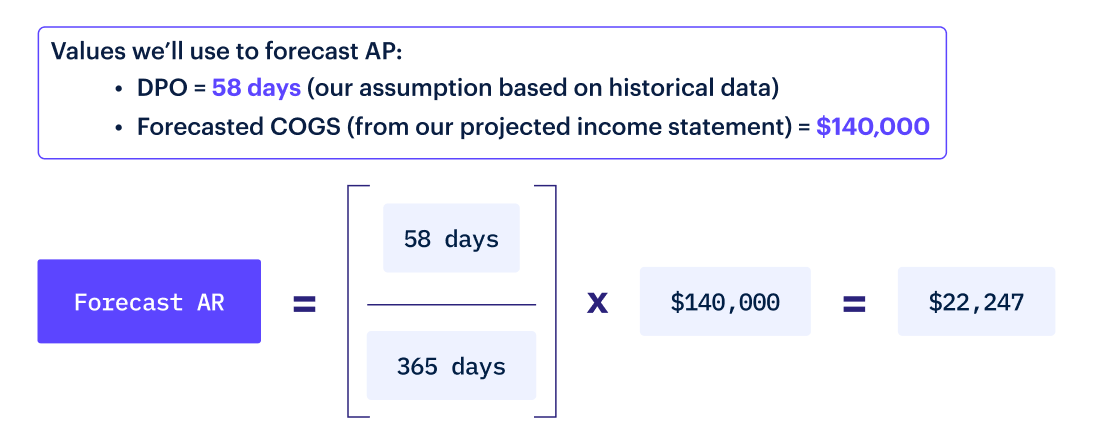
To forecast the accounts payable (AP), we’ll use a metric for working capital management called days payable outstanding (DPO), which measures the number of days it takes a business to pay back its AP.
The DPO formula divides the AP for the previous period or most recent balance sheet by the cost of goods sold (COGS) for the previous period.

Below is the formula for calculating forecasted AP using the DPO from the previous period, which we assume to be the same in the next period, and the forecasted COGS from the projected income statement:

Here’s an example calculation of forecasted AP:
Forecast deferred revenue
You can come up with deferred revenue by first forecasting your total sales or revenue for the period. Then, you refer to the revenue recognition schedule to determine what portion of those sales will be recognized immediately and what portion will be deferred.
This is the amount you’ll report on your balance sheet under liabilities.
Forecast non-current liabilities
In SaaS, these will generally be loans and possibly lines of credit the company has been issued.
Forecasting the liability associated with loans is simply a matter of looking at the repayment and amortization schedule for each outstanding loan.
Likewise, you can forecast the liabilities associated with any lines of credit by looking at the balances and what you pay on them each month.
In either case, interest expense should be included.
Step 4. Determine the shareholder equity
Calculate retained earnings
Retained earnings can be easily calculated by considering the last period’s retained earnings and adding the current period’s net income.
For SaaS startups, this number is usually negative because they reinvest their earnings in the business to fuel growth. However, just to clarify, this isn’t a universal rule.
The amount of retained earnings on your balance sheet ultimately comes down to the company’s reinvestment strategies. Some SaaS startups may have positive retained earnings if their revenue exceeds their costs and reinvestments, depending on where they are in the growth journey.
Calculate the equity
To determine the equity, you calculate the value of the stock options you plan to give to your employees, either for new big hires or your existing employees, as a part of their appraisal cycle.
You should also account for any new investment or funding rounds you expect to close as these represent additional equity in your business.
Step 5. Now, pull it all together in your balance sheet forecast
The beauty of the balance sheet equation is that it always adds up.
The fundamental equation shown below represents that all company assets are financed by borrowing money (liabilities) or investments from shareholders (shareholders' equity).
If it doesn’t add up, it indicates an error in the accounting records. This could be due to data entry errors, miscalculations, omission of transactions, or incorrect classification of accounts.
A balanced balance sheet is a fundamental requirement in accounting. So, if it doesn’t balance, you’ll need to figure out why.

Common challenges with balance sheet forecasting
Reliability of data
We want to preface our discussion regarding data quality by saying that we know that it’s hard to get truly clean data. However, while data quality issues are common, they shouldn’t stop you from building a balance sheet forecast.
Your data will become cleaner over time and even faster if you use a platform like Drivetrain. For example, once your systems are integrated with Drivetrain, the platform will flag potential data quality issues making them easier to spot and resolve quickly.
With that in mind, here are the main data quality and reliability issues you might encounter when doing balance sheet forecasting:
- Accuracy concerns: Ensuring the accuracy of historical data, which forms the basis of forecasting, can be challenging. Any errors in past financial records can significantly skew forecasts. The prudent way forward is to try and get as close to reality as possible by reducing obvious errors and misses.
- Predictive limitations: Reliance on historical trends doesn't always accurately predict future outcomes, especially in rapidly changing markets or for that matter, SaaS startups with limited historical data.
Consistent data collection
Consistent data collection is important because if you can eliminate the obstacles in aggregating your data, the accuracy of your projections will improve with time because you’ll have more time to proactively clean your data as you go. Hence, your ability to gain valuable insights from your balance sheet forecast will increase, too.
- Standardization issues: Difficulty in maintaining consistency in data collection methods across different departments and time periods can lead to inconsistencies, affecting the quality of forecasts. It is important to standardize data entry from the get-go or start as early as possible or at least the first time you spot an issue.
- Integration challenges: Integrating data from various sources or tools can take a lot of time, hindering effective data collection and subsequent forecast analysis.
Drivetrain makes balance sheet forecasting easy
Balance sheet forecasting using spreadsheets like Excel is hard as it is prone to manual data entry and formula errors. Spreadsheets aren’t scalable and become bulky with complex data, not to mention the lack of automation and integration, making it difficult to collaborate.
Also, with spreadsheets, one can only do so much financial modeling and analysis and that, too, requires a lot of time and effort.
With a smart FP&A tool like Drivetrain, you can seamlessly streamline your balance sheet forecasting:
- Drivetrain automatically aggregates data from various sources, saving you loads of time and giving you the confidence in knowing that the data feeding your forecast is always up to date.
- You can standardize and automate metrics from various systems. Once you integrate with Drivetrain, we will help you flag unclean data so that, over time, your data becomes cleaner.
- If you have a metric where the numerator comes from, say, a Netsuite, but the denominator comes from Hubspot, Drivetrain can automate the calculation of that metric, making it a set-it-and-forget-it task.
- You can also run various ‘what-if’ scenarios and do predictive modeling to develop sophisticated balance sheet forecasts.
Trade in your spreadsheets for a platform that allows you to scale with ease as the complexity in your business grows. Contact us for your free demo.


.svg)


